Team performance
Der Bericht Teamleistung in der Personalbeschaffungsapp zeigt an, wie viele Bewerber jeder Personalverantwortliche betreut.
Diese Informationen werden von den Personen festgelegt, die das Feld Personalvermittler auf jedem Bewerberformular ausfüllen.
Bericht öffnen
Um auf den Bericht Teamleistung zuzugreifen, navigieren Sie zu .
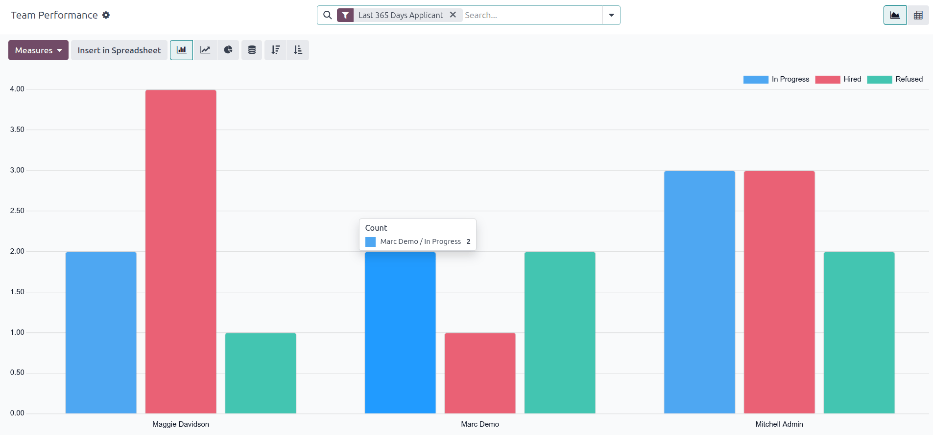
The number of In Progress, Hired, and Refused applicants for each recruiter is displayed in a default (Graph) view.
Die angezeigten Informationen entsprechen dem Standardfilter Bewerber der letzten 365 Tage, wie in der Suchleiste angezeigt.
Fahren Sie mit dem Mauszeiger über eine beliebige Spalte, um ein Pop-over-Fenster mit den spezifischen Details für diese Spalte anzuzeigen.
Ansicht der Pivot-Tabelle
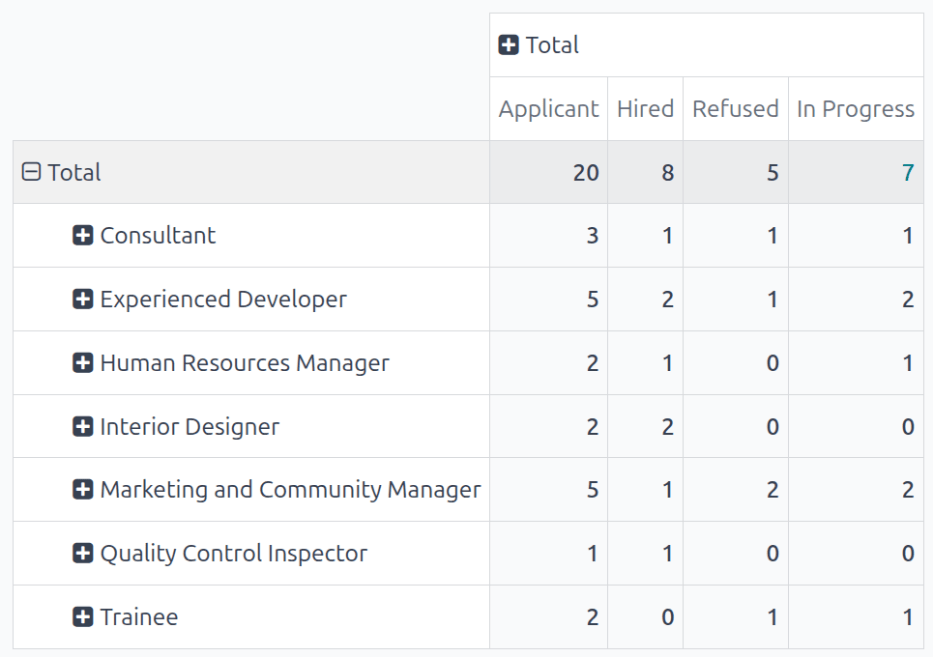
Um eine detailliertere Ansicht der Informationen des Berichts Teamleistung zu erhalten, klicken Sie auf ads Symbol (Pivot) oben rechts. Dadurch werden alle Daten in einer Pivot-Tabelle angezeigt.
In this view, the job positions populate the rows, while the columns populate the number of applicants. The first column, Applicant, is the total number of applicants across all stages for that job position. The subsequent columns display the total applicants that have been Hired, Refused, and In Progress for each job position.
Die angezeigten Informationen können bei Bedarf geändert werden.
In this example, there are 20 total applicants. Out of those 20, eight have been hired, five have been refused, and seven are still in the recruitment process.
From the data presented, the Experienced Developer job position is the most successful. This job position has one of the highest number of total applicants (tied with the Marketing and Community Manager position), as well as the most hires.
This pivot table also shows that the Quality Control Inspector position is the hardest to fill, as it has the fewest total applicants.
Anwendungsfall: Leistung von Personalvermittlern im Laufe der Zeit
Eine Möglichkeit, diesen Bericht zu ändern, besteht darin, die Leistung von Personalvermittlern im Laufe der Zeit darzustellen. Um diese Informationen anzuzeigen, beginnen Sie mit dem Bericht Teamleistung in der Ansicht (Pivot).
Next, click the (down arrow) in the search bar, revealing a drop-down menu. Click Add Custom Group at the bottom of the Group By column, then click Recruiter. Click away from the drop-down menu to close it. Now, each row on the table represents a recruiter.

To compare the team’s performance over different time periods, click the (down arrow) in the search bar. Click Application Date in the Filters column, revealing various time periods to select.
In this example, the desired data is the comparison between the team’s performance in the third quarter (June - August) and the second quarter (April - July). To do so, click Q3. Once clicked, the current year is also ticked. In this example, it is 2025.
Nach der Auswahl wird eine Spalte Vergleich angezeigt. Klicken Sie auf Startdatum: Vorheriger Zeitraum, um das dritte Quartal mit dem zweiten Quartal für die verschiedenen Personalvermittler zu vergleichen.
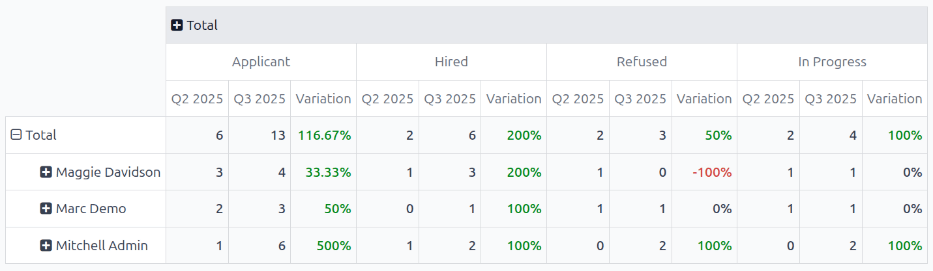
From this report, some things can be extrapolated: the total number of applicants, the number of hired applicants, the number of refused applicants, and the number of applicants still in the recruitment pipeline all increased.
Additionally, Maggie Davidsons had the highest increase in number of hired applicants during the third quarter, while their number of refused applicants went down.