Applicant analysis
The Applicant Analysis report allows recruiting departments to see which job positions have the most applicants, which have the most referrals, and how long it takes for applicants to move through the pipeline.
Knowing how many applicants each specific job position has, along with statistics about how many are hired and refused, can provide valuable insights. This information can assist the recruiting team to pivot their strategies to acquire the most desirable candidates.
Applicant analysis report
Start by navigating to . This presents a line chart of all applicants for the last year.
Three separate color-coded metrics are presented: In Progress, Hired, and Refused.
Hover the cursor over a month of the chart, and a pop-up window appears, displaying the specific numbers for that month.

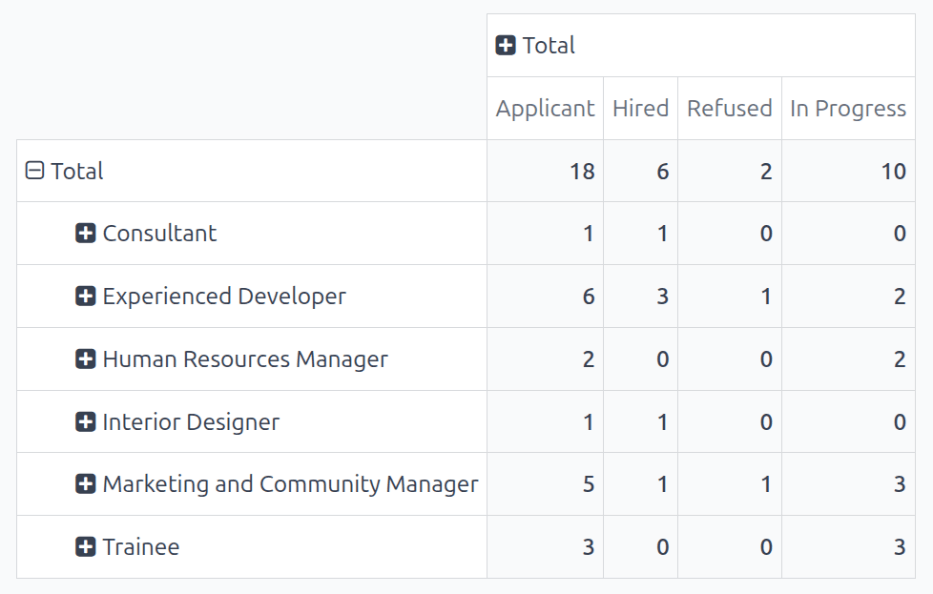
Pivot table view
For a more detailed view of the information in the Applicant Analysis report, click the (Pivot) icon in the top-right corner. This displays all the information in a pivot table.
In this view, the job positions are displayed in the rows, and the columns display the total numbers of applicants, including how many of those applicants were hired or refused, and who is still in the recruitment process. The displayed information can be modified, if desired.
In this example, there are 18 total applicants. Out of that, six have been hired, two have been refused, and ten are still in the recruitment pipeline. The Experienced Developer position has six total applicants, three of which were hired, one refused, and two still in progress.
Use case: applicants with referrals
To get a better understanding of how effective the company’s referral program is, the Applicant Analysis report can be modified to show how many applicants were referred by current employees.
From the (Pivot) view of the Applicant Analysis report, first click the Measures button to reveal a drop-down menu of options.
Click both Has Referrer and Count, to activate those two measures. Then, click Applicant, Hired, In Progress and Refused to deactivate those default measures.
Now, the column displays the number of applicants that came from a referral in the Has Referrer column, and the total number of applicants in the Count column.

In this example, the Experienced Developer and Interior Designer job positions both have applicants from referrals, while the rest do not have any referrals.
Hired through referrals
It is possible to modify this report even further to see how many referred applicants end up being hired.
To view this data, click on a [job position] row, which reveals a drop-down menu. Then, click State to show the various states applicants are currently in.
Nota
Only states that have applicants in them are shown for each job position. If a state does not have any applicants, it does not appear in the list.
To expand the other rows, and display the various states, click on the [job position] button.

Both the Experienced Developer and Interior Designer roles yielded one referral hire each, confirming that developers and designers generate the highest-success referrals.