PDF-rapporter
Med Studio kan du redigera befintliga PDF-rapporter (t.ex. fakturor, offerter osv.) eller skapa nya.
Standardlayout
Standardlayouten för rapporter hanteras utanför Studio. Gå till , och sedan i sektionen Företag på huvudsidan, klicka på Konfigurera dokumentlayout. Layoutinställningar är företagsspecifika men gäller för alla rapporter.
Tips
Du kan se hur de olika inställningarna påverkar rapportlayouten i rapportförhandsvisningen på höger sida av fönstret Konfigurera din dokumentlayout. När du skapar eller redigerar en rapport kan du se en förhandsvisning av rapporten genom att klicka på Förhandsgranska utskrift på vänster sida av skärmen.
Använd följande inställningar:
Layout: Sju layouter är tillgängliga:


Bakgrund: Följande bakgrunder är tillgängliga:
Tom: Ingenting visas.
Demologo: En demologo visas i bakgrunden.
Anpassad: Ladda upp en anpassad bakgrundsbild.
Text: Åtta typsnitt är tillgängliga: Lato, Roboto, Open Sans, Montserrat, Oswald, Raleway, Tajawal (som stödjer arabiska och latinska skript) och Fira Mono. Gå till Google Fonts webbplats för att förhandsgranska dem.
Företagets logotyp: Klicka på knappen Redigera för att ladda upp eller ändra logotypen. Logotypen läggs då till i företagets register i Företag-modellen, som du kommer åt genom att gå till och sedan klicka på Uppdatera info i avsnittet Företag.
Färger: Ändra de primära och sekundära färger som används för att strukturera rapporter. Standardfärgerna genereras automatiskt baserat på färgerna i logotypen.
Adress: Företagets namn och adress visas i sidhuvudet på externa rapporter. Du kan lägga till flera textrader.
Tagline: Detta visas i sidhuvudet på externa rapporter som använder layouterna Light, Striped, Bubble, Wave och Folder och i sidfoten på externa rapporter som använder layouterna Boxed och Bold. Du kan lägga till flera textrader.
Pappersformat: Detta definierar standardpappersstorleken för rapporter. Du kan välja A4 (21 cm x 29,7 cm) och US Letter (21,59 cm x 27,54 cm). Detta kan också definieras för individuella rapporter i fältet Pappersformat i Studio.
Observera
Andra pappersformat kan vara tillgängliga beroende på vilka appar eller moduler du har installerat, t.ex. etikettsark för Lager-appen eller eventbrickor för Evenemang-appen.
Skapa nya PDF-rapporter
För att skapa en ny rapport för en modell (t.ex. försäljningsorder) öppnar du modellen, klickar på knappen (Växla Studio) och klickar sedan på Rapporter. Klicka på Ny och välj rapporttypen i popup-fönstret som öppnas. Detta används enbart för att bestämma vad som visas i sidhuvudet och sidfoten:
När du har skapat rapporten kan du börja redigera den.
Redigera PDF-rapporter
För att komma åt de rapporter som är tillgängliga för en modell öppnar du modellen, klickar på knappen (Växla Studio) och klickar sedan på Rapporter. Välj en befintlig rapport för att öppna den.
Alternativt kan du också öppna Studio, klicka på Reports och söka efter en specifik rapport eller modell.
Viktigt
Det rekommenderas starkt att skapa en kopia av standardrapporten och göra ändringar i den kopierade versionen. För att skapa en kopia av en rapport håller du muspekaren över det övre högra hörnet av rapporten, klickar på ikonen (vertikal ellips) och väljer sedan Skapa kopia.

Alternativ
När du har valt eller skapat en rapport kan du använda alternativen i vänstra delen av skärmen för att:
Ändra Rapportnamn: Det nya namnet tillämpas överallt (i Studio, i menyn Skriv ut under ikonen (kugghjul) i formulärvyn och i PDF-filnamnet).
Ändra Pappersformat: Om inget värde väljs används formatet som definierats i standardlayouten.
Visa i utskriftsmeny: för att lägga till rapporten i menyn Skriv ut i formulärvyn.
Reload from attachment: för att spara rapporten som en bilaga på posten första gången den genereras och ladda om originalversionen av rapporten när som helst därefter. Detta är ett lagkrav för fakturor och används främst i detta fall.
Begränsa synlighet till grupper: för att begränsa tillgängligheten för PDF-rapporten till specifika användargrupper.
Redigera källor: för att ändra rapporten direkt i XML-filen.
Reset report: för att ta bort alla ändringar som gjorts i rapporten och återställa den till standardversionen.
Print preview: för att generera och ladda ner en förhandsgranskning av rapporten.
Redaktör för rapporten
Rapportredigeraren låter dig ändra innehållet och formateringen av rapporten.
Tips
Du kan Ångra eller Gör om ändringar med hjälp av relaterade knappar eller genvägarna
CTRL+ZochCTRL+Y.Ändringar sparas automatiskt när du lämnar rapporten eller manuellt med knappen Save.
Du kan återställa rapporten till standardversionen genom att klicka på knappen Återställ rapport i den vänstra delen av skärmen.
Viktigt
Redigering av sidhuvud och sidfot i en rapport påverkar alla standardrapporter och anpassade rapporter.
Villkorliga block
De streckade rektanglarna representerar villkorliga block (if/else-satser). Dessa används för att visa/dölja innehåll baserat på specifika villkor. Klicka på blocket för att visa villkoren.
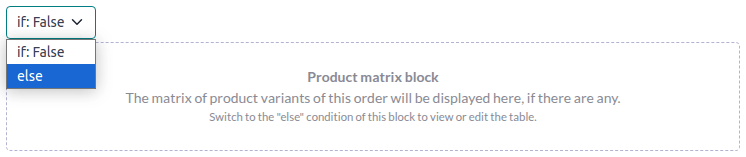
Välj ett värde för att förhandsgranska dess motsvarande utdata och redigera den vid behov.
Observera
Villkor kan endast redigeras i XML.
Annat innehåll
Det finns två typer av textinnehåll i rapporter:
Statisk text, dvs. texten som inte är markerad i blått, kan ändras direkt i redigeraren.
Dynamisk text, dvs. texten som är markerad i blått, som ersätts av :doc:`fält </applications/studio/fields>`värden när rapporten genereras, t.ex. försäljningsordernumret eller offertdatumet.
Du kan lägga till innehåll (t.ex. fält, listor, tabeller, bilder, banners, osv.) i rapporten med hjälp av kommandon. Skriv / för att öppna powerbox, skriv sedan kommandots namn eller välj det från listan.
Om du vill lägga till statisk text i rapporten skriver du texten där du vill ha den.
För mer avancerade ändringar kan du redigera rapporten i XML direkt.
Lägg till ett fält
För att lägga till ett fält, skriv / och välj kommandot Fält. I listan som öppnas, välj eller sök efter fältet; klicka på högerpilen bredvid fältnamnet för att komma åt listan över relaterade fält om det behövs. Ange sedan standardvärdet som kommer att visas om fältet inte är ifyllt i handlingen och tryck på Enter.

Lägg till eller redigera en tabell
Det finns två typer av tabeller i rapporter:
Statiska tabeller, som används för att visa statisk text eller fält. För den här typen av tabell definierar du antalet kolumner och rader när du lägger till tabellen.
Dynamiska tabeller, som används för att visa data från relationsfält. För den här typen av tabell definierar du bara antalet kolumner när du lägger till tabellen. Antalet rader i den genererade rapporten bestäms av antalet handlingar i den relaterade modellen som är länkade till den aktuella modellen.
Example
I en försäljningsorderrapport används en dynamisk tabell för att visa orderraderna relaterade till försäljningsordern. Om försäljningsordern innehåller 10 orderrader har tabellen i den genererade rapporten 10 rader; om den innehåller två orderrader har tabellen två rader.
Lägg till eller redigera en statisk tabell
För att lägga till en statisk tabell, skriv / och välj kommandot Tabell. Bestäm antalet kolumner och rader för tabellen. När tabellen har lagts till kan du börja redigera den.
Du kan infoga, flytta och radera kolumner och rader med hjälp av tabellverktygen. Placera markören ovanför kolumnen eller till vänster om raden, klicka sedan på den lila rektangeln och välj ett alternativ.

För att ändra storlek på en kolumn, dra kolumnkanten till önskad position; återställ alla kolumner till deras standardstorlek genom att välja Återställ storlek från tabellverktygen.
Lägg till fältet du väljer i en cell eller lägg till statisk text genom att skriva.
Tips
För att lägga till text på ett strukturerat sätt utan att använda en tabell kan du använda kolumner. Lägg till kolumner genom att skriva / och välja lämpligt kommando: 2 kolumner, 3 kolumner eller 4 kolumner.
Lägg till eller redigera en dynamisk tabell
Observera
Endast relationer av typen
one2manyellermany2manykan visas som dynamiska tabeller.En befintlig dynamisk tabell i en standardrapport har en mer komplex struktur än en dynamisk tabell du lägger till själv. För sådana tabeller är det möjligt att infoga eller radera kolumner; det är inte möjligt att flytta kolumner eller att infoga, flytta eller radera rader.
För att lägga till en dynamisk tabell, skriv / och välj kommandot Dynamisk tabell. I listan som öppnas, välj eller sök efter relationen som tabellen ska baseras på och tryck på Enter. När tabellen har lagts till kan du börja redigera den.
Du kan infoga, flytta och radera kolumner med hjälp av tabellverktygen, som för en statisk tabell. Det är också möjligt att infoga statiska rader som kommer att visas ovanför eller under de genererade raderna.
För att lägga till ett fält i en cell, radera eventuell platshållartext och lägg sedan till fältet som du väljer. Dialogrutan som öppnas visar källobjektet för fältet (t.ex. modellen Orderrader) och listan över tillgängliga fält.

Ersätt etiketten Column name med den etikett som du väljer.
Observera
Standardraden itererar automatiskt över fältets innehåll och genererar en rad i rapporten för varje fältvärde (t.ex. en rad per orderrad).
Formatering
För att formatera text i rapporten, markera den och formatera den sedan med hjälp av alternativen i textredigeraren.

Redigera rapportens XML
Varning
Om du ändrar XML direkt kan det leda till rapportproblem under uppgraderingar. Om detta händer kopierar du helt enkelt dina ändringar från den gamla databasen till den uppgraderade databasen.
För att redigera rapportens XML, klicka på Redigera källor i den vänstra rutan.
Exempel
För att ändra hur data presenteras i rapporten kan du ändra ett fälts standard-widget manuellt. I exemplet nedan visar orderdatumet datum och tid som standard, medan priset per enhet som standard har en precision på två decimaler.
<div class="oe_structure">
 <span t-field="doc.date_order"/>
 <span t-field="doc.price_unit"/>
</div>
Genom att använda t-options, i det här fallet alternativet widget, kan dessa fält ändras för att visa endast datumet respektive en precision på fyra decimaler:
<div class="oe_structure">
 <span t-field="doc.date_order" t-options="{'widget': 'date'}"/>
 <span t-field="doc.price_unit" t-options="{'widget': 'float', 'precision': 4}"/>
</div>
Om du vill visa/dölja innehåll baserat på specifika villkor, kan du manuellt lägga till if/else kontrollsatser i rapportens XML.
Om du t.ex. vill dölja en anpassad datatabell om det inte finns några taggar kan du använda attributet t-if för att definiera villkoret, som sedan utvärderas som True eller False. Tabellen visas inte om det inte finns några taggar i citatet.
<!-- table root element -->
<table class="table" t-if="len(doc.tag_ids) > 0">
    <!-- thead = table header, the row with column titles -->
    <thead>
        <!-- table row element -->
        <tr>
            <!-- table header element -->
            <th>ID</th>
            <th>Name</th>
        </tr>
    </thead>
    <!-- table body, the main content -->
    <tbody>
        <!-- we create a row for each subrecord with t-foreach -->
        <tr t-foreach="doc.tag_ids" t-as="tag">
            <!-- for each line, we output the name and price as table cells -->
            <td t-out="tag.id"/>
            <td t-out="tag.name"/>
        </tr>
    </tbody>
</table>
Om du vill visa ett annat block om t-if-satsen utvärderas som False, kan du ange det med hjälp av t-else-satsen. t-else-blocket måste följa direkt efter t-if-blocket i dokumentstrukturen. Det finns ingen anledning att ange något villkor i t-else-attributet. Som exempel kan vi visa ett snabbt meddelande som förklarar att det inte finns några taggar i citatet:
<!-- table root element -->
<table class="table" t-if="len(doc.tag_ids) > 0">
    <!-- thead = table header, the row with column titles -->
    <thead>
        <!-- table row element -->
        <tr>
            <!-- table header element -->
            <th>ID</th>
            <th>Name</th>
        </tr>
    </thead>
    <!-- table body, the main content -->
    <tbody>
        <!-- we create a row for each subrecord with t-foreach -->
        <tr t-foreach="doc.tag_ids" t-as="tag">
            <!-- for each line, we output the name and price as table cells -->
            <td t-out="tag.id"/>
            <td t-out="tag.name"/>
        </tr>
    </tbody>
</table>
<div class="text-muted" t-else="">No tag present on this document.</div>
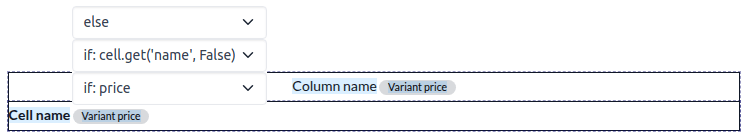
Genom att använda notationen t-if/t-else visar rapportredigeraren att dessa avsnitt är ömsesidigt uteslutande och bör visas som villkorliga block:

Du kan byta villkor med hjälp av editorn för att förhandsgranska deras resultat:

Om du vill ha flera alternativ kan du också använda t-elif-direktiv för att lägga till mellanliggande villkor. Så här ändras t.ex. titeln på försäljningsorderrapporter baserat på villkoret för det underliggande dokumentet.
<h2 class="mt-4">
    <span t-if="env.context.get('proforma', False) or is_pro_forma">Pro-Forma Invoice # </span>
    <span t-elif="doc.state in ['draft','sent']">Quotation # </span>
    <span t-else="">Order # </span>
    <span t-field="doc.name">SO0000</span>
</h2>
Titeln Pro-Forma Invoice används beroende på vissa kontextuella villkor. Om dessa villkor inte är uppfyllda och dokumentets status är antingen draft eller sent, då används Quotation. Om inget av dessa villkor är uppfyllda är rapportens titel Order.
Att arbeta med bilder i en rapport kan vara utmanande, eftersom exakt kontroll över bildstorlek och bildbeteende inte alltid är uppenbar. Du kan infoga bildfält med hjälp av rapportredigeraren (genom att använda kommandot Fält), men att infoga dem i XML med hjälp av direktivet t-field och medföljande t-options-attribut ger bättre kontroll över storlek och positionering.
Följande kod matar t.ex. ut fältet image_128 för radens produkt som en 64px bred bild (med en automatisk höjd baserad på bildens bildförhållande).
<span t-field="line.product_id.image_128" t-options-widget="image" t-options-width="64px"/>
Följande alternativ är tillgängliga för bildwidgets:
width: bildens bredd, vanligtvis i pixlar eller CSS-längdenheter (t.ex.rem) (lämna tomt för automatisk bredd).height: bildens höjd, vanligtvis i pixlar eller CSS-längdenheter (t.ex.rem) (lämna tomt för automatisk höjd).class: CSS-klasser som tillämpas påimg-taggen; Bootstrap-klasser är tillgängliga.alt: alternativ text för bildenstyle: stilattribut; det gör att du kan åsidosätta stilar mer fritt än med Bootstrap classes.
Dessa attribut måste innehålla strängar, dvs. text omsluten av citattecken inom citattecken, t.ex. t-options-width="'64px'" (eller, alternativt, ett giltigt Python-uttryck).
Observera
Bildwidgeten kan inte användas på en img-tagg. Ställ istället in t-field-direktivet på en span (för inline-innehåll) eller div (för blockinnehåll) nod.
Låt oss till exempel lägga till en kolumn med produktbilden i offert-tabellen:
<table class="table table-sm o_main_table table-borderless mt-4">
    <thead style="display: table-row-group">
        <tr>
            <th>Image</th>
            <th name="th_description" class="text-start">Description</th>
            <th>Product Category</th>
            <th name="th_quantity" class="text-end">Quantity</th>
            <th name="th_priceunit" class="text-end">Unit Price</th>
[...]
        <t t-foreach="lines_to_report" t-as="line">
            <t t-set="current_subtotal" t-value="current_subtotal + line.price_subtotal"/>
            <tr t-att-class="'bg-200 fw-bold o_line_section' if line.display_type == 'line_section' else 'fst-italic o_line_note' if line.display_type == 'line_note' else ''">
                <t t-if="not line.display_type">
                   <td>
                       <span t-field="line.product_template_id.image_128"
                             t-options-widget="'image'"
                             t-options-width="'64px'"
                             t-options-class="'rounded-3 shadow img-thumbnail'"
                           />
                   </td>
                    <td name="td_name"><span t-field="line.name">Bacon Burger</span></td>
                    <td t-out="line.product_id.categ_id.display_name"/>
Attributet t-options-width begränsar bildbredden till 64 pixlar, och Bootstrap-klasserna som används i t-options-class skapar en miniatyrliknande ram med rundade hörn och en skugga.
