팀 성과 보고
채용 앱에 있는 팀별 실적 보고서에서 각 채용 담당자가 관리하는 지원자 수를 확인할 수 있습니다.
이 내용은 각 지원자 양식의 채용 담당자 필드에 입력되는 개인별로 지정됩니다.
보고서 열기
팀 성과 보고서에 액세스하려면 로 이동합니다.
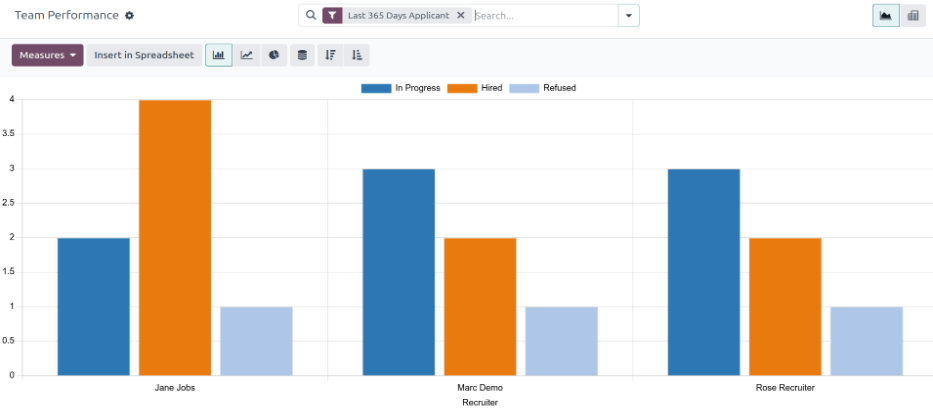
The number of In Progress, Hired, and Refused applicants for each recruiter is displayed in the (Graph) view.
The information shown is for the Last 365 Days Applicant default filter, as displayed in the search bar.
Hover the cursor over any column to view a popover window, displaying the specific details for that column.

피벗 테이블 보기
팀 성과 보고서를 더 자세히 확인하려면 오른쪽 상단에 있는 (피벗) 아이콘을 클릭합니다. 이렇게 하면 피벗 테이블에 모든 내용이 표시됩니다.
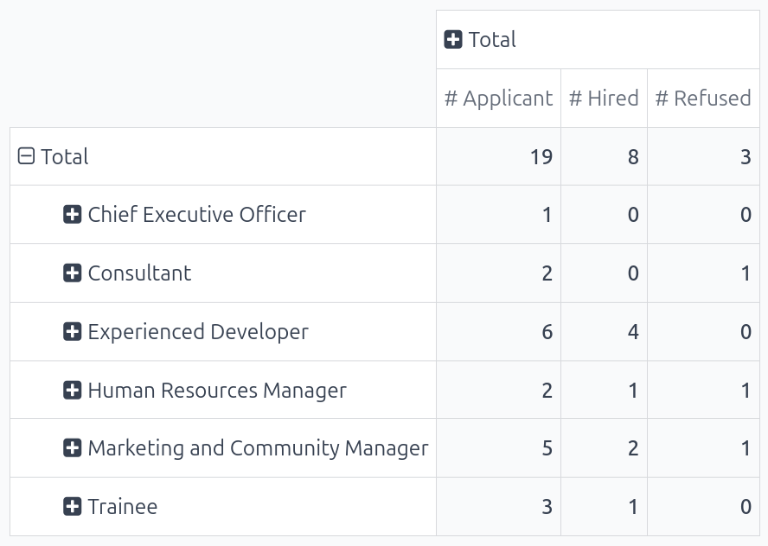
이 보기에서 직무는 행에 표시되고 열에는 총 지원자 수가 표시됩니다. 지원자는 지원자 수 (진행 중), 합격자 수, 불합격자 수 로 더욱 자세히 분류됩니다.
표시 정보는 원하는 경우 수정할 수 있습니다.
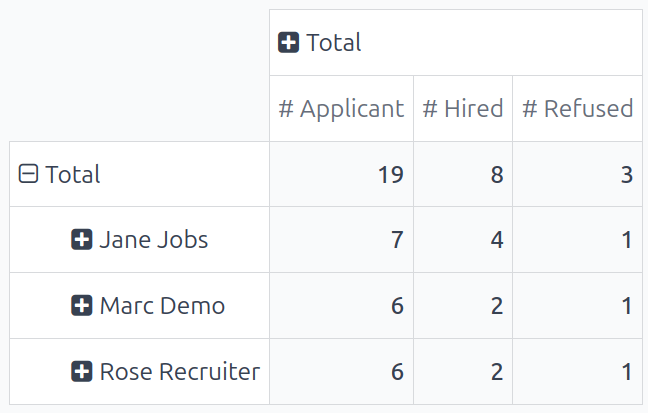
In this example, there are 19 total applicants. Out of those 19, eight have been hired, and three refused.
제시된 데이터에서 개발 경력자 직무에서 결과가 가장 성공적입니다. 이 부문에 총 지원자 수가 가장 많고 채용된 인원도 가장 많습니다. 또한 개발 경력자 는 지원자 중에 불합격자 수가 가장 적습니다.
This pivot table also shows that the Chief Executive Officer position is the hardest to fill, as it has the fewest total applicants.

사용 사례: 채용 담당자의 기간별 실적
이 보고서를 수정하는 방법 중 하나는 채용 담당자의 시간 경과에 따른 성과를 나타내는 것입니다. 이 내용을 표시하려면 (피벗) 보기에서 팀 성과 보고서부터 시작하세요.
다음으로 검색 창에 있는 (아래쪽 화살표) 를 클릭하여 드롭다운 메뉴를 표시합니다. 그룹 기준 열 하단에서 사용자 지정 그룹 추가 을 클릭한 다음, 채용 담당자 를 클릭합니다. 드롭다운 메뉴 바깥 부분을 클릭하여 닫습니다. 이제 표에서각 행은 채용 담당자를 나타냅니다.

팀의 성과를 여러 기간에 걸쳐 비교하려면 검색창에서 (아래쪽 화살표) 를 클릭합니다. 필터 열에서 시작 일 을 클릭하면 다양한 기간이 선택할 수 있도록 표시됩니다.
이 예시에서 확인하고자 하는 데이터는 3분기 (6월~8월)와 2분기 (4월~7월)에 대한 팀 성과를 비교하는 것입니다. 확인하려면 Q3 을 클릭합니다. 클릭하면 현재 연도까지 같이 체크됩니다. 이 예시에서는 2024 가 되겠습니다.
이렇게 선택하면 비교 열이 나타납니다. 시작일: 이전 기간 을 클릭하면 여러 명의 채용 담당자들에 대한 3분기와 2분기 성과를 비교합니다.

이 보고서에서 여러 가지 사실을 알 수 있습니다. 총 지원자 수는 증가했고, 합격자 수는 같으며, 불합격자 수는 감소했습니다.
또한 채용 사이트 1 에서 3분기에 지원자 수가 가장 많이 증가했지만 합격자 수는 67% 감소했습니다. 전체적으로 가장 좋은 수치를 보인 업체는 채용 사이트 2 로, 3분기에 활성 지원자와 합격자 수가 모두 증가하고 불합격자는 감소했습니다.