
Team performance reporting
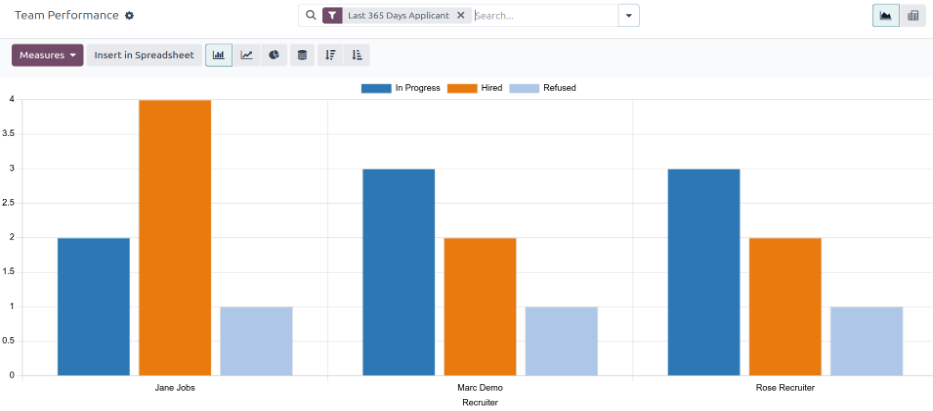
รายงาน ประสิทธิภาพของทีม ในแอป การรับสมัคร แสดงจำนวนผู้สมัครที่ผู้รับสมัครแต่ละคนกำลังจัดการ
ข้อมูลนี้ถูกกำหนดโดยบุคคลที่กรอกข้อมูลในฟิลด์ Recruiter ในแบบฟอร์มผู้สมัครแต่ละคน
เปิดรายงาน
เพื่อเข้าถึงรายงาน ประสิทธิภาพของทีม ให้ไปที่
The number of In Progress, Hired, and Refused applicants for each recruiter is displayed in the (Graph) view.
ข้อมูลที่แสดงคือสำหรับตัวกรองเริ่มต้น Last 365 Days Applicant ตามที่แสดงในแถบค้นหา
เลื่อนเคอร์เซอร์ไปเหนือคอลัมน์ใดก็ได้เพื่อดูหน้าต่างป๊อปโอเวอร์ที่แสดงรายละเอียดเฉพาะสำหรับคอลัมน์นั้น
มุมมองตารางสรุปข้อมูล
สำหรับมุมมองที่ละเอียดยิ่งขึ้นของข้อมูลในรายงาน Team Performance ให้คลิกไอคอน (Pivot) ที่มุมบนขวา นี่จะแสดงข้อมูลทั้งหมดในตารางสรุปข้อมูล
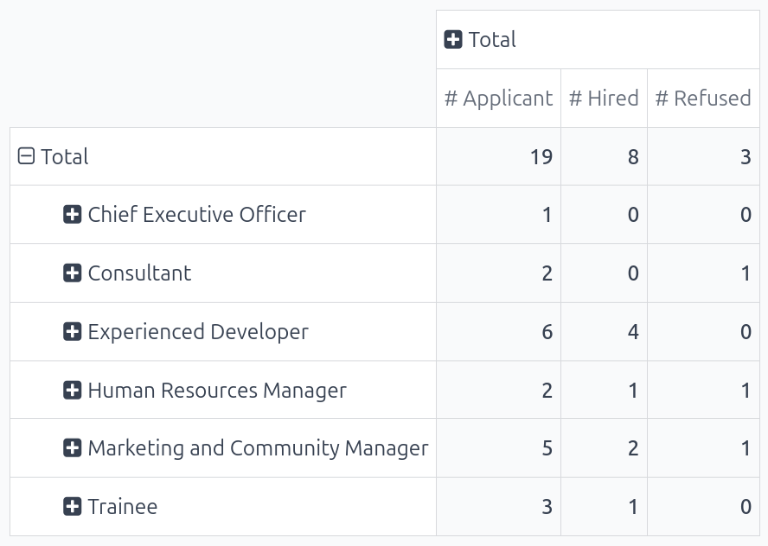
In this view, the job positions are displayed in the rows, while the columns display the total number of applicants. The applicants are further organized by # Applicant (in process), # Hired, and # Refused.
ข้อมูลที่แสดงสามารถแก้ไขได้หากต้องการ
In this example, there are 19 total applicants. Out of those 19, eight have been hired, and three refused.
From the data presented, the Experienced Developer job position is the most successful. This job position has the highest number of total applicants, as well as the most hires. In addition, the Experienced Developer has the least amount of refused applicants.
This pivot table also shows that the Chief Executive Officer position is the hardest to fill, as it has the fewest total applicants.
กรณีการใช้งาน: ประสิทธิภาพของผู้รับสมัครเมื่อเวลาผ่านไป
วิธีหนึ่งในการปรับเปลี่ยนรายงานนี้คือการแสดงให้เห็นว่าผู้รับสมัครมีประสิทธิภาพเป็นอย่างไรเมื่อเวลาผ่านไป เพื่อแสดงข้อมูลนี้ ให้เริ่มต้นจากรายงาน Team Performance ในมุมมอง (Pivot)
Next, click the (down arrow) in the search bar, revealing a drop-down menu. Click Add Custom Group at the bottom of the Group By column, then click Recruiter. Click away from the drop-down menu to close it. Now, each row on the table represents a recruiter.

To compare the team's performance over different time periods, click the (down arrow) in the search bar. Click Start Date in the Filters column, revealing various time periods to select.
In this example, the desired data is the comparison between the team's performance in the third quarter (June - August) and the second quarter (April - July). To do so, click Q3. Once clicked, the current year is also ticked. In this example, it is 2024.
หลังจากทำการเลือกนี้ คอลัมน์ Comparison จะปรากฏขึ้น คลิก Start Date: Previous Period เพื่อเปรียบเทียบไตรมาสที่สามกับไตรมาสที่สองสำหรับผู้รับสมัครต่าง ๆ
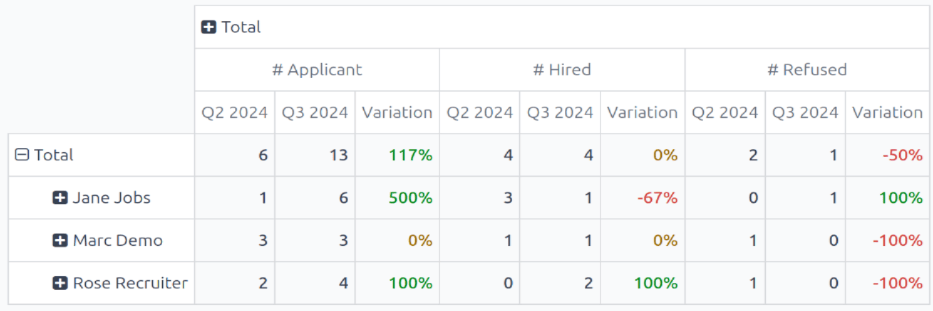
From this report, several things can be extrapolated: the total number of applicants increased, the number of hired applicants remained the same, while the number of refused applicants decreased.
นอกจากนี้ Jane Jobs ยังมีจำนวนผู้สมัครเพิ่มขึ้นสูงสุดในไตรมาสที่ 3 แต่จำนวนผู้สมัครที่ได้รับการว่าจ้างกลับลดลง 67% บริษัทจัดหางานที่มีตัวเลขโดยรวมดีที่สุดคือ Rose Recruiter ซึ่งมีทั้งผู้สมัครที่ยังทำงานอยู่และผู้สมัครที่ได้รับการว่าจ้างเพิ่มขึ้นในไตรมาสที่ 3 ในขณะที่ผู้สมัครที่ถูกปฏิเสธกลับลดลง