예상 수익 보고서
Expected revenue is the total cash value of leads that are expected to close by a certain date, usually the end of the current month.
예상 수익 보고서 에서는 예상 마감일이 설정된 영업 파이프라인 상의 모든 활성 영업제안을 수집하고, 지정된 기간의 영업팀 간의 실적을 비교합니다.

매월 불러오는 예상 매출 보고서를 통해, 영업 관리자는 목표를 달성한 팀원이 누구인지를 파악하고, 중요한 거래를 성사시키기 위해 추가적인 지원이 필요한 팀원에 대해서도 확인할 수 있습니다.
예상 수익 보고서 만들기
To create an expected revenue report, first navigate to . This opens the Pipeline Analysis dashboard.
중요
The Pipeline Analysis dashboard includes several filters in the search bar by default. Remove these before adding any additional custom filters.
보고서 왼쪽 상단에서 측정값 을 클릭한 후, 드롭다운 메뉴에서 예상 수익 을 선택합니다.
페이지 상단에서 검색… 표시줄 오른쪽에 있는 🔻(아래쪽 삼각형) 아이콘을 클릭하여 필터, 그룹 기준 및 :guilabel:` 즐겨찾기` 열에 있는 드롭다운 메뉴를 엽니다. guilabel:필터 열 아래 사용자 지정 필터 추가 를 클릭하면 사용자 지정 필터 추가 팝업 창이 열립니다.
맞춤 필터 추가
In order to generate an expected revenue report, filters need to be created for the following conditions:
Expected closing date: limits results to only include leads expected to close within a specific time frame.
미배정 영업제안 제외: 배정된 영업 담당자가 없는 영업제안은 제외됩니다.
특정 영업팀: 하나 이상의 영업팀에 배정된 영업제안만 결과가 나타나도록 합니다. 이 필터는 선택 사항이며 보고서가 회사 전체를 대상으로 하는 경우 이 필터는 사용하지 않습니다.
마감 예상일 필터 추가하기
사용자 지정 필터 추가 팝업 창에서 새 규칙의 첫 번째 필드를 클릭합니다. 검색… 표시줄에 예상 마감 을 입력하거나 스크롤을 이동하여 목록에서 선택합니다. 두 번째 필드를 클릭하고 설정됨 을 선택합니다. 이렇게 하면 예상 마감일이 있는 영업제안만 결과에 나오게 됩니다.
그런 다음 규칙 오른쪽에 있는 ➕(더하기) 아이콘을 클릭하면 규칙이 복제됩니다.
팁
Using the ➕ (plus) icon makes it easy to add multiple rules based on the same filter.
새 규칙의 두 번째 필드에 있는 드롭다운 메뉴에서 사이에 있음 을 선택합니다. 이렇게 하면 일정한 기간이 생성되며 이 기간에는 반드시 영업제안이 결과에 포함되기 위한 예상 마감일이 있어야 합니다.
각 날짜 필드를 한 번에 하나씩 클릭하고 캘린더 팝오버 창을 사용하여 시작일과 종료일을 규칙에 모두 추가합니다. 이는 일반적으로 현재 월 또는 회계 분기의 시작일과 종료일입니다.
배정되지 않은 영업제안 제외하기
예상 마감일로 필터를 적용한 후 새 규칙 을 추가합니다. 그런 다음 새 규칙의 첫 번째 필드를 클릭하고 검색… 막대에 영업 담당자 를 입력하거나 목록을 스크롤하여 선택합니다. 규칙에 있는 두 번째 필드를 클릭하고 드롭다운 메뉴에서 설정됨 을 선택합니다. 이렇게 하면 배정된 영업 담당자가 없는 결과는 제외됩니다.
영업팀 필터 추가하기
참고
This filter is optional. To view results for the entire company, do not add this filter, and continue to View results.
보고서 결과에 하나 이상 영업 팀이 나타나도록 제한하려면 새 규칙 을 클릭합니다. 다음으로, 새 규칙의 첫 번째 필드를 클릭하고 검색… 표시줄에 영업 팀 을 입력하거나 목록을 스크롤로 검색하여 찾습니다.
In the rule’s second field, select is in from the drop-down menu. Selecting this operator limits results to the sales teams indicated in the next field.
마지막으로 세 번째 필드를 클릭하여 팝오버 메뉴에 표시된 전체 목록에서 선택하거나 특정 영업팀 이름에 있는 처음 몇 글자를 입력하여 빠르게 찾아서 매개변수로 선택합니다.
팁
Multiple teams can be added to the Sales Team rule, where each parameter is treated with an
“or” (e.g. “any”) operator in the search logic.

결과 보기
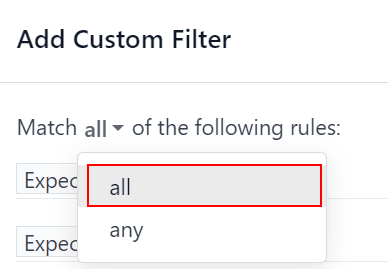
사용자 지정 필터 추가 양식 상단에는 규칙 중 일부 또는 전부 와 일치시키는 옵션이 있습니다. 보고서를 제대로 실행하려면 다음 필터 전부 와 일치하는 레코드만 있어야 합니다. 필터를 추가하기 전에 여기에서 전부 가 선택되어 있는지 확인합니다.

사용자 지정 필터 추가 양식의 하단에 있는 추가 를 클릭합니다.
화면 옵션
예상 수익 보고서는 다양한 보기를 활용함으로써 유용하게 사용할 수 있습니다. 기본 그래프 보기를 사용하면 가장 매출이 높을 것으로 예상되는 영업 담당자를 파악할 수 있으며, 목록 보기와 피벗 보기를 통해 특정 거래에 대해 자세한 정보를 확인할 수 있습니다.
그래프 보기 는 데이터 시각화에 활용되며 패턴과 추세를 파악하는 데 유용합니다.
Bar charts are used to show the distribution of data across several categories or among several salespeople.
꺾은선그래프 는 일정한 기간 동안의 추세 변화를 나타낼 때 유용합니다.
원 그래프 는 카테고리나 영업 담당자 수가 많지 않을 때 데이터 분포를 나타내거나 비교를 할 때 사용하며, 특히 전체적으로 봤을 때 얼마나 유의미한지 파악하고자 할 때 유용합니다.
예상 수익 보고서의 기본 보기는 누적형 막대 그래프입니다. 다른 그래프 보기로 전환하려면 보고서 왼쪽 상단에 있는 아이콘 중에서 하나를 클릭합니다. 누적 보기에서는 꺾은선 그래프와 막대 그래프는 모두 사용할 수 있지만 원 그래프는 사용할 수 없습니다.

그래프 보기 아이콘 순서: 막대그래프, 선그래프, 원그래프, 누적형 그래프 순서입니다.
목록 보기 에서는 지정된 날짜까지 성사될 것으로 예상하는 영업제안 목록을 모두 확인할 수 있습니다. 목록 보기에서 영업제안을 클릭하면 자세하게 분석할 수 있도록 레코드가 열리지만 기본 보기를 통해서도 깊이있는 이해를 할 수 있습니다.
To switch to the list view, click the ≣ (list) icon at the top-right of the report.
To add additional metrics to the report, click the additional options menu indicated by the toggle icon at the top-right of the list.

목록 보기 에서 토글 아이콘을 클릭하면 추가 옵션 메뉴 가 열립니다.
Select any additional metrics from the drop-down menu to add them to the list view. Some options that may be useful are Expected Closing and Probability.
The pivot view arranges all leads that are expected to close by the designated date into a dynamic table.
피벗 보기로 전환하려면 보고서 오른쪽 상단에 있는 피벗 아이콘을 클릭합니다.
이 보고서에서 피벗 보기를 선택하면 X축에는 파이프라인의 단계가 표시되고, Y축에는 기본적으로 생성 날짜별 결과가 그룹으로 표시됩니다. 이와 같은 그룹을 전환하려면 보고서 상단에 있는 액세스 전환 아이콘 (⇄)을 클릭합니다.
To add additional measures to the report, click the Measures button at the top-left of the report. Select any additional metrics from the drop-down menu.
피벗 화면의 행이나 열에 그룹을 추가하려면 총계 옆에 있는 :guilabel:`➕ (더하기 기호)`를 클릭한 다음 그룹 중에서 하나를 선택합니다. 삭제하려면 :guilabel:`➖ (빼기 기호)`를 클릭하여 선택되어 있는 해당 옵션을 취소합니다.
피벗 보기를 편집 가능한 스프레드시트 형식으로 현황판 앱 내에서 추가하려면 스프레드시트에 삽입 을 클릭합니다. Odoo 문서 앱이 설치되어 있는 경우 보고서를 빈 스프레드시트 또는 기존 스프레드시트에 삽입하여 내보낼 수 있습니다.