Analisis Saluran
Aplikasi CRM mengelola pipeline sales selagi lead/peluang bergerak dari tahap ke tahap, awal ke sale (Won) atau pengarsipan (Lost).
Setelah mengatur pipeline, gunakan opsi-opsi pencarian dan laporan yang tersedia di halaman Analisis Pipeline untuk mendapatkan wawasan ke efektivitas pipeline dan usernya.
Untuk mengakses halaman Analisis Pipeline, kunjungi .

Menavigasi halaman analisis pipeline
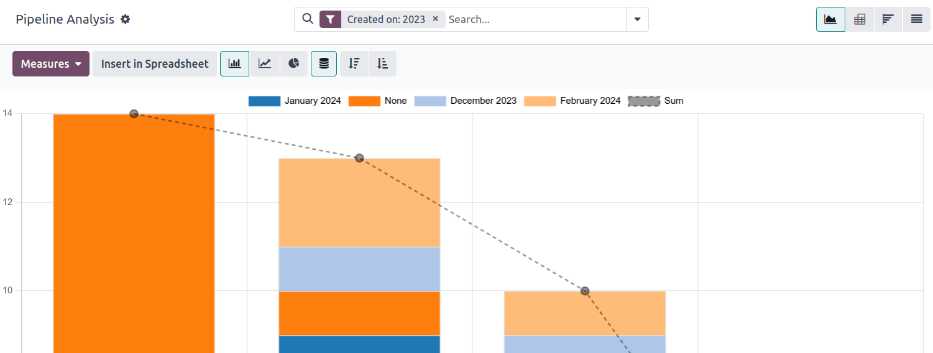
Setelah mengakses halaman Analisis Pipeline, diagram batang yang menunjukkan lead dari tahun lalu secara otomatis mengisi. Batang-batang merepresentasikan jumlah lead di setiap tahap pipeline sales, sementara warna menunjukkan bulan apa lead mencapai tahap tersebut.
Elemen-elemen interaktif halaman Analisis Pipeline memanipulasi grafik untuk melaporkan metric-metric yang berbeda di tampilan yang berbeda-beda. Dari kiri-ke-kanan, atas-ke-bawah, elemen-elemen termasuk:
Action: diwakili oleh ikon ⚙️ (roda gigi), berlokasi di sebelah judul halaman Analisis Pipeline. Saat diklik, menu drop-down muncul dengan tiga opsi, masing-masing dengan sub-menu mereka sendiri: Pengetahuan, Dashboard, Spreadsheet. (Lihat Simpan dan bagikan laporan untuk informasi lebih banyak)
Opsi Pengetahuan adalah untuk menghubungkan ke atau untuk memasukkan grafik ke artikel aplikasi Pengetahuan.
Opsi Dashboard adalah untuk menambahkan grafik ke dashboard di aplikasi Dashboard.
Opsi Spreadsheet adalah untuk menghubungkan grafik di spreadsheet di aplikasi Dokumen.
Kolom Pencarian...: menunjukkan filter dan pengelompokkan yang saat ini diterapkan ke grafik. Untuk menambahkan filter/kelompok baru, ketik mereka ke kolom pencarian, atau klik ikon ⬇️ (arah panah bawah), di akhir kolom, untuk membuka menu drop-down opsi. (Lihat Opsi Pencarian untuk informasi lebih banyak)
Di pojok kanan-atas, terdapat opsi-opsi tampilan yang diwakili oleh ikon-ikon yang berbeda. (Lihat Opsi-Opsi Tampilan untuk informasi lebih banyak)
Tampilan Grafik: tampilkan data di diagram batang. Ini adalah tampilan default.
Tampilan Pivot: menampilkan data dalam tabel metrik yang dapat dikustomisasi, dikategorikan.
Tampilan Cohort: menampilkan dan mengatur data, berdasarkan minggu (standar), hari, bulan, atau tahun mereka Dibuat dan Tanggal Penutupan mereka.
Tampilan List: menampilkan data dalam list.
Berlokasi di sisi kiri-jauh halaman, di bawah judul halaman Analisis Pipeline, terdapat lebih banyak filter dan opsi tampilan yang dapat dikonfigurasi.
Pengukuran: buka menu drop-down opsi-opsi pengukuran yang berbeda yang dapat dilihat di tampilan grafik, pivot atau cohort. Menu drop-down Pengukuran tidak tersedia di tampilan list. (Lihat Opsi-opsi Pengukuran untuk informasi lebih lanjut)
Masukkan di Spreadsheet: membuka jendela pop-up dengan opsi-opsi untuk menambahkan grafik atau meja pivot ke spreadsheet di aplikasi Dokumen atau dashboard di aplikasi Dashboard. Opsi ini tidak tersedia di tampilan cohort atau list.
Dengan memilih tampilan grafik, opsi-opsi berikut tersedia:
Diagram Batang: mengganti diagram menjadi batang.
Diagram Garis: mengganti diagram menjadi garis.
Diagram Lingkaran: mengganti diagram menjadi garis.
Bertumpuk: saat dipilih, hasil dari setiap tahap diagram ditumpuk di atas masing-masing. Saat tidak dipilih, hasil di setiap tahap ditunjukkan sebagai batang-batang individu.
Menurun: mengurutkan ulang tahap-tahap di diagram dalam urutan menurun dari kiri-ke-kanan. Klik ikon kedua kalinya untuk membatalkan pilihan. Tergantung pada kriteria pencarian, opsi ini mungkin tidak tersedia.
Menaik: mengurutkan ulang tahap-tahap di diagram dalam urutan menaik dari kiri-ke-kanan. Klik ikon kedua kalinya untuk membatalkan pilihan. Tergantung pada kriteria pencarian, opsi ini mungkin tidak tersedia.
Dengan memilih tampilan pivot, opsi-opsi berikut tidak tersedia:
Balik Axis: balik axis X dan Y untuk seluruh tabel.
Perluas Semua: saat pengelompokkan tambahan dipilih menggunakan ikon ➕ (tanda plus), tombol ini membuka kelompok-kelompok tersebut di bawah setiap baris.
Unduh xlsx: mengunduh tabel sebagai file Excel.
Opsi-opsi pencarian
Halaman Analisis Pipeline dapat dikustomisasi dengan beragam filter dan opsi pengelompokkan.
Untuk menambahkan kriteria pencarian baru, ketik kriteria yang diinginkan ke kolom pencarian, atau klik ikon ⬇️ (arah panah bawah), di sebelah kolom pencarian, untuk membuka menu drop-down semua opsi. Lihat bagian-bagian di bawah untuk informasi lebih lanjut untuk apa yang setiap opsi lakukan.

Bagian Filter-filter memungkinkan user-user untuk menambahkan filter-filter yang dibuat sebelumnya dan kustom ke kriteria pencarian. Lebih dari satu filter dapat ditambahkan ke satu pencarian.
Pipeline Saya: tunjukkan lead-lead yang ditugaskan ke user saat ini.
Peluang: tunjukkan lead-lead yang telah memiliki kualifikasi sebagai peluang.
Lead: tunjukkan lead-lead y ang belum berkualifikasi sebagai peluang-peluang.
Aktif: tunjukkan lead-lead aktif.
Tidak aktif: tunjukkan lead-lead yang tidak aktif.
Won: tunjukkan lead-lead yang telah ditandai sebagai Won.
Lost: tunjukkan lead-lead yang telah ditandai sebagai Lost.
Dibuat Pada: tunjukkan lead-lead yang dibuat pada periode waktu tertentu. Secara default, ini adalah tahun lalu, tapi dapat disesuaikan sesuai kebutuhan, atau dihapus sepenuhnya.
Perkiraan Penutupan: tunjukkan lead-lead yang diharapkan untuk menutup (ditandai Won) pada periode waktu tertentu.
Tanggal Ditutup: tunjukkan lead-lead yang ditutup (ditandai Won) pada periode waktu tertentu.
Diarsip: tunjukkan lead-lead yang telah diarsip (ditandai Lost).
Tambahkan Filter Kustom: mengizinkan user untuk membuat filter kustom dengan beragam opsi-opsi. (Lihat Filter-Filter Kustom dan Kelompok-Kelompok untuk informasi lebih lanjut)
Bagian Kelompokkan Berdasarkan memungkinkan user-user untuk menambahkan pengelompokkan yang sudah dibuat sebelumnya dan kustom ke hasil pencarian. Lebih dari satu pengelompokkan dapat ditambahkan untuk memisah hasil-hasil menjadi bagian-bagian yang lebih mudah dikelola.
Penting
Urutan kelompok yang ditambahkan memengaruhi bagaimana hasil-hasil final ditampilkan. Coba memilih kombinasi yang sama dengan urutan yang berbeda untuk melihat apa yang paling baik untuk setiap kasus penggunaan.
Salesperson: mengelompokkan hasil berdasarkan Salesperson yang mana lead ditugaskan.
Tim Sales: mengelompokkan hasil berdasarkan Tim Sales yang mana lead ditugaskan.
Kota: mengelompokkan hasil berdasarkan kota dari mana lead berasal.
Negara: mengelompokkan hasil berdasarkan negara dari mana lead berasal.
Perusahaan: mengelompokkan hasil berdasarkan perusahaan dari mana lead berasal (bila lebih dari satu perusahaan diaktifkan di database).
Tahap: mengelompokkan hasil berdasarkan tahap-tahap di pipeline sales.
Kampanye: mengelompokkan hasil berdasarkan kampanye marketing dari mana lead berasal.
Medium: mengelompokkan hasil berdasarkan medium (Email, Google Adwords, Website, dsb.) dari manal lead berasal.
Sumber: mengelompokkan hasil berdasarkan sumber (Search engine, Lead Recall, Newsletter, dsb.) dari mana lead berasal.
Tanggal Pembuatan: kelompokkan hasil berdasarkan tanggal kapan lead ditambahkan ke database.
Tanggal Konversi: mengelompokkan hasil berdasarkan berdasarkan tanggal lead dikonversi menjadi peluang.
Perkiraan Penutupan: mengelompokkan hasil berdasarkan tanggal lead diharapkan ditutup (ditandai "Won").
Tanggal Penutupan: mengelompokkan hasil berdasarkan tanggal lead ditutup (ditandai "Won").
Alasan Lost: mengelompokkan hasil berdasarkan alasan terpilih saat lead ditandai sebagai "Lost."
Tambahkan Kelompok Kustom: mengizinkan user untuk membuat kelompok kustom dengan beragam opsi-opsi. (Lihat Menambahkan Filter-Filter dan Kelompok-Kelompok Kustom untuk informasi lebih lanjut)
Bagian Perbandingan memungkinkan user untuk membandingkan pembanding ke kriteria pencarian yang sama selama periode waktu tertentu.
Opsi ini hanya tersedia bila pencarian termasuk filter-filter berdasarkan waktu, seperti Dibuat Pada, Perkiraan Penutupan, atau Tanggal Penutupan. Walau lebih dari satu filter berdasarkan waktu dapat ditambahkan sekaligus, hanya satu pembanding dapat dipilih pada satu waktu.
Periode Sebelumnya: menambahkan pembanding ke kriteria pencarian yang sama dari periode sebelumnya.
Tahun Sebelumnya: menambahkan pembanding ke kriteria pencarian yang sama dari tahun sebelumnya.
Bagian Favorit-Favorit memungkinkan user-user untuk menyimpan pencarian untuk nanti, sehingga tidak perlu dibuat ulang setiap kali.
Lebih dari satu pencarian dapat disimpan, dibagikan dengan orang lain, atau bahkan ditetapkan sebagai default untuk kapan pun halaman Analisis Pipeline dibuka.
Simpan pencarian saat ini: simpan kriteria pencarian saat ini untuk nanti.
Filter default: saat menyimpan pencarian, centang kotak ini untuk membuatnya filter pencarian default saat halaman Analisis Pipeline dibuka.
Dibagikan: saat menyimpan pencarian, centang kotak ini untuk membuatnya tersedia untuk user lain.
Tambahkan filter-filter dan kelompok-kelompok kustom
Sebagai tambahan ke opsi-opsi yang dibuat sebelumnya di kolom pencarian, halaman Analisis Pipeline dapat juga menggunakan filter-filter dan kelompok-kelompok kustom.
Filter-filter kustom adalah peraturan-peraturan rumit yang lebih lanjut mengustomisasikan hasil pencarian, sementara kelompok-kelompok kustom menampilkan informasi dengan cara yang lebih teratur.
Untuk menambahkan filter kustom:
Di halaman Analisis Pipeline, klik ikon arah panah bawah di bawah kolom Pencarian....
Di menu drop-down, klik Tambahkan Filter Kustom.
Jendela pop-up Tambahkan Filter Kustom muncul dengan peraturan default (Negara di _____) terdiri dari tiga field unik. Field-field ini dapat diedit untuk membuat peraturan kustom, dan lebih dari satu peraturan dapat ditambahkan ke satu filter kustom.
Untuk mengedit peraturan, mulai dengan mengeklik field pertama (Negara), dan pilih opsi dari menu drop-down. Field pertama menentukan subjek primer peraturan.
Berikutnya, klik field kedua, dan pilih opsi dari menu drop-down. Field kedua menentukan hubungan field pertama dan ketiga, dan biasanya adalah statement adalah atau adalah tidak, tapi juga dapat merupakan lebih besar dari atau lebih kecil dari, dan lebih banyak lagi.
Terakhir, klik field ketiga, dan pilih opsi dari menu drop-down. Field ketiga menentukan subjek kedua peraturan.
Dengan tiga field terpilih, peraturan selesai.
Untuk menambahkan lebih banyak peraturan: klik Peraturan Baru dan ulangi langkah-langkah 4-7, sesuai kubutuhan.
Untuk menghapus peraturan: klik ikon 🗑️ (tong sampah) di kanan peraturan.
To duplicate an existing rule: click the ➕ (plus sign) icon to the right of the rule.
To create more complex rules: click the Add branch icon to the right of the rule. This adds another modifier below the rule for adding an "all of" or "any of" statement.

Once all rules have been added, click Add to add the custom filter to the search criteria.
To remove a custom filter: click the ✖️ (x) icon beside the filter in the search bar.
To add a custom group:
On the Pipeline Analysis page, click the down arrow icon next to the search bar.
In the drop-down menu that appears, click Add Custom Group.
Scroll through the options in the drop-down menu, and select one or more groups.
To remove a custom group: click the ✖️ (x) icon beside the custom group in the search bar.
Measurement options
By default, the Pipeline Analysis page measures the total Count of leads that match the search criteria, but can be changed to measure other items of interest.
To change the selected measurement, click the Measures button on the top-left of the page, and select one of the following options from the drop-down menu:
Days to Assign: measures the number of days it took a lead to be assigned after creation.
Days to Close: measures the number of days it took a lead to be closed (marked Won).
Days to Convert: measures the number of days it took a lead to be converted to an opportunity.
Exceeded Closing Days: measures the number of days by which a lead exceeded its Expected Closing date.
Expected MRR: measures the Expected Recurring Revenue of a lead.
Expected Revenue: measures the Expected Revenue of a lead.
Prorated MRR: measures the Prorated Monthly Recurring Revenue of a lead.
Prorated Recurring Revenues: measures the Prorated Recurring Revenues of a lead.
Prorated Revenue: measures the Prorated Revenue of a lead.
Recurring Revenues: measures the Recurring Revenue of a lead.
Count: measures the total amount of leads that match the search criteria.
Lihat opsi
After configuring filters, groupings, and measurements, the Pipeline Analysis page can display the data in a variety of ways. By default, the page uses the graph view, but can be changed to a pivot view, cohort view, or list view.
To change the pipeline to a different view, click one of the four view icons, located in the top-right of the Pipeline Analysis page.
The graph view is the default selection for the Pipeline Analysis page. It displays the analysis as either a: bar chart, line chart, or pie chart.
This view option is useful for quickly visualizing and comparing simple relationships, like the Count of leads in each stage, or the leads assigned to each Salesperson.
By default, the graph measures the Count of leads in each group, but this can be changed by clicking the Measures button, and selecting another option from the resulting drop-down menu.

Tip
When using a bar chart in this view, consider deselecting the Stacked option, in order to make the breakdown of results more legible.
The pivot view displays the results of the analysis as a table. By default, the table groups the results by the stages of the sales pipeline, and measures Expected Revenue.
The pivot view is useful for analyzing more detailed numbers than the graph view can handle, or for adding the data to a spreadsheet, where custom formulas can be set up, like in an Excel file.

The three icons at the top-left of the page perform the following functions:
Balik Axis: balik axis X dan Y untuk seluruh tabel.
Perluas Semua: saat pengelompokkan tambahan dipilih menggunakan ikon ➕ (tanda plus), tombol ini membuka kelompok-kelompok tersebut di bawah setiap baris.
Unduh xlsx: mengunduh tabel sebagai file Excel.
Catatan
The Stage grouping cannot be removed, but the measurement can be changed by clicking the Measures button, and selecting another option.
The cohort view displays the analysis as periods of time (cohorts) that can be set to days, weeks, months, or years. By default, Week is selected.
This view option is useful specifically for comparing how long it has taken to close leads.

From left-to-right, top-to-bottom, the columns in the chart represent the following:
Created On: rows in this column represent the weeks of the year, in which records matching the search criteria exist.
When set to Week, a row with the label W52 2023 means the results occurred in: Week 52 of the Year 2023.
Measures: the second column in the chart is the measurement of the results. By default, it is set to Count, but can be changed by clicking the Measures button, and selecting an option from the drop-down menu.
Closed Date - By Day/Week/Month/Year: this column looks at what percentage of the measured results were closed in subsequent days/weeks/months/years.
Average: this row provides the average of all other rows in the column.
The cohort view can also be downloaded as an Excel file, by clicking the Download icon in the top-left of the page.
The list view displays a single list of all leads matching the search criteria. Clicking a lead opens the record for closer review. Additional details such as Country, Medium, and more can be added to the list, by clicking the Filters icon in the top-right of the list.
This view option is useful for reviewing many records at once.

Clicking the ⚙️ (gear) icon opens the Actions drop-down menu, with options for the following:
Import records: opens a page for uploading a spreadsheet of data, as well as a template spreadsheet to easily format that data.
Export All: downloads the list as an xlsx file for Excel.
Knowledge: inserts a view of, or link to, the list in an article in the Knowledge app.
Dashboard: adds the list to My Dashboard in the Dashboards app.
Spreadsheet: links to, or inserts, the list in a spreadsheet in the Documents app.
Catatan
On the list view, clicking New closes the list, and opens the New Quotation page. Clicking Generate Leads opens a pop-up window for lead generation. Neither feature is intended to manipulate the list view.
Create reports
After understanding how to navigate the pipeline analysis page, the Pipeline Analysis page can be used to create and share different reports. Between the pre-made options and custom filter and groupings, almost any combination is possible.
Once created, reports can be saved to favorites, shared with other users, and/or added to dashboards and spreadsheets.
A few common reports that can be created using the Pipeline Analysis page are detailed below.
Win/Loss reports
Win/Loss is a calculation of active or previously active leads in a pipeline that were either marked as Won or Lost over a specific period of time. By calculating opportunities won over opportunities lost, teams can clarify key performance indicators (KPIs) that are converting leads into sales, such as specific teams or team members, certain marketing mediums or campaigns, and so on.
A win/loss report filters the leads from the past year, whether won or lost, and groups the results by their stage in the pipeline. Creating this report requires a custom filter, and grouping the results by Stage.

Follow the steps below to create a win/loss report:
Navigate to .
On the Pipeline Analysis page, click the ⬇️ (down arrow) icon, next to the search bar, to open a drop-down menu of filters and groupings.

In drop-down menu that appears, under the Group By heading, click Stage.
Under the Filters heading, click Add Custom Filter to open another pop-up menu.
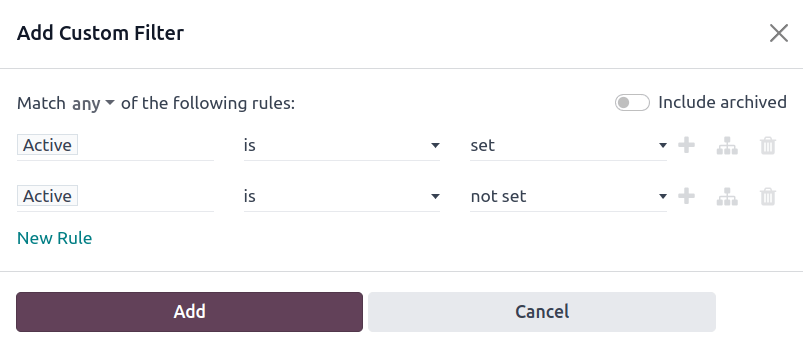
In the Add Custom Filter pop-up menu, click on the first field in the Match any of the following rules: section. By default, this field displays Country.
Clicking that first field reveals a sub-menu with numerous options to choose from. From this sub-menu, locate and select the Active option. Doing so automatically populates the remaining fields.
The first field reads: Active. The second field reads: is. And lastly, the third field reads: set.
In total, the rule reads: Active is set.
Click New Rule, change the first field to Active, and the last field to not set. In total, the rule reads Active is not set.
Click Add.
The report now displays the total Count of leads, whether "Won" or "Lost," grouped by their stage in the CRM pipeline. Hover over a section of the report to see the number of leads in that stage.

Customize win/loss reports
After creating a win/loss report, consider using the options below to customize the report for different needs.
Example
A sales manager might group wins and losses by salesperson, or sales team, to see who has the best conversion rate. Or, a marketing team might group by sources, or medium, to determine where their advertising has been most successful.
To add more filters and groups, click the ⬇️ (down arrow) icon, next to the search bar, and select one or more options from the drop-down menu.
Some useful options include:
Created on: adjusting this filter to a different period of time, such as the last 30 days, or the last quarter, can provide more timely results.
Add Custom Filter: clicking this option, and scrolling through the numerous options in the drop-down menu, opens up additional search criteria, like Last Stage Update or Lost Reason.
Add Custom Group > Active: Clicking separates the results into Won (true) or Lost (false). This shows at what stage leads are being marked Won or Lost.
Multiple Groupings: add multiple Group By selections to split results into more relevant and manageable chunks.
Adding Salesperson or Sales Team breaks up the total count of leads in each Stage.
Adding Medium or Source can reveal what marketing avenues generate more sales.
By default, pivot view groups win/loss reports by Stage and measures Expected Revenue.
To flesh out the table:
Click the ⬇️ (down arrow) next to the search bar.
In the pop-up menu, replace the Stage grouping with something like Salesperson or Medium.
Click the Measures button and click Count to add the number of leads back into the report.
Other useful measures for pivot view include Days to Assign and Days to Close.

Penting
In pivot view, the Insert In Spreadsheet button may be greyed out due to the report containing duplicate group bys. To fix this, replace the Stage grouping in the search bar with another option.
In list view, a win/loss report displays all leads on a single page.
To better organize the list, click the ⬇️ (down arrow) next to the search bar, and add more relevant groupings or re-organize the existing ones. To re-order the nesting, remove all Group By options and re-add them in the desired order.
To add more columns to the list:
Click the Filters icon in the top-right of the page.
Select options from the resulting drop-down menu. Some useful filters include:
Campaign: Shows the marketing campaign that originated each lead.
Medium: Shows the marketing medium (Banner, Direct, Email, Google Adwords, Phone, Website, etc.) that originated each lead.
Source: Shows the source of each lead (Newsletter, Lead Recall, Search Engine, etc.).

Save and share reports
After creating a report, the search criteria can be saved, so the report does not need to be created again in the future. Saved searches automatically update their results every time the report is opened.
Additionally, reports can be shared with others, or added to spreadsheets/dashboards for greater customization and easier access.
To save a report for later:
On the Pipeline Analysis page, click the ⬇️ (down arrow) icon, next to the search bar.
In the drop-down menu that appears, under the Favorites heading, click Save current search.
In the next drop-down menu that appears, enter a name for the report.
Checking the Default filter box sets this report as the default analysis when the Pipeline Analysis page is accessed.
Checking the Shared box makes this report available to other users.
Finally, click Save. The report is now saved under the Favorites heading.

Inserting a report into a spreadsheet not only saves a copy of the report, it allows users to add charts and formulas like in an Excel file.
To save a report as a spreadsheet:
In Graph or Pivot View:
Click the Insert in spreadsheet button.
In the pop-up menu that appears, click Confirm.
In Cohort or List View:
Click the ⚙️ (gear) icon.
In the drop-down menu that appears, hover over Spreadsheet.
In the next drop-down menu, click either Insert in spreadsheet or Link in spreadsheet.
Saved reports are viewable in the Documents app.

Tip
After modifying a spreadsheet and adding additional formulas, consider then adding the entire spreadsheet to a dashboard. Using this method, the spreadsheet can be added to a public dashboard instead of only My Dashboard.
Click .
In the pop-up menu that appears, name the spreadsheet and select a Dashboard Section to house the report.
Click Create.
Adding a report to a dashboard saves it for later and makes it easy to view alongside the rest of My Dashboard.
To add a report to My dashboard:
On the Pipeline Analysis page, click the ⚙️ (gear) icon.
In the drop-down menu that appears, hover over Dashboard.
In the Add to my dashboard drop-down menu, enter a name for the report (by default, it is named Pipeline).
Click Add.
To view a saved report:
Return to the main apps page, and navigate to .
