Employee retention report
It is possible to determine the retention rate for a company by modifying an existing report.
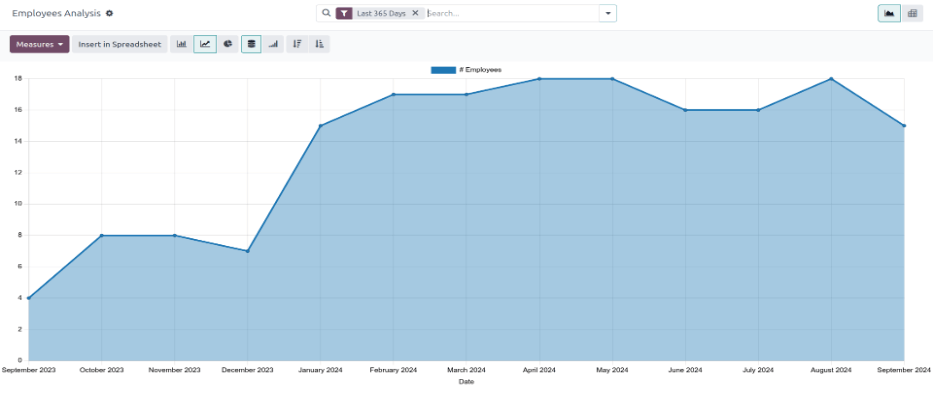
First, navigate to to open the Employee Analysis report. This report shows the number of all employees for the Last 365 Days, in a default Line Chart.

Next, click the Measures button in the upper-left corner, revealing a drop-down menu. Click # Departure Employee in the list, then click away from the drop-down menu to close it. Now, the report shows all the employees who were archived for the Last 365 Days.
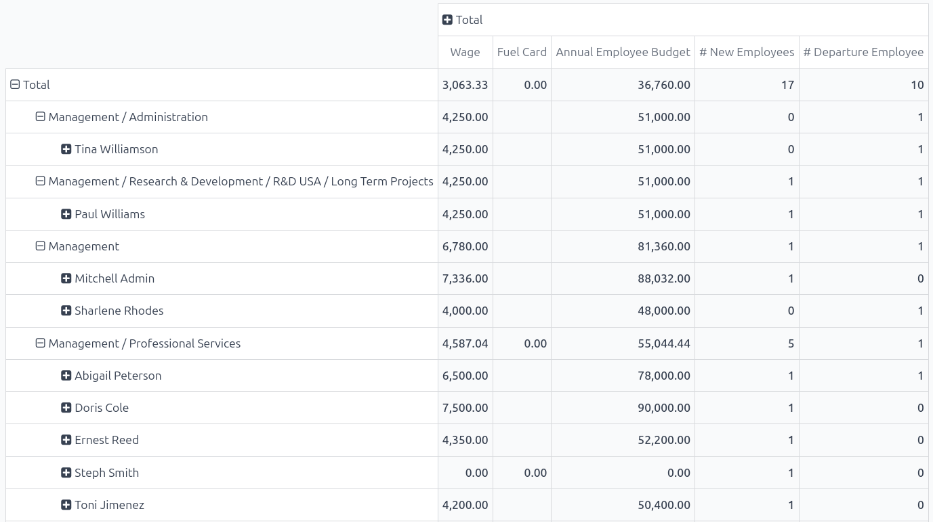
To view this information in an easier format, click the (Pivot) icon in the upper-right corner, and the data is presented in a pivot table.
The various employees, organized by department, populate the rows. The columns display the following totals: the monthly Wage, the Fuel Card budget, total Annual Employee Budget (also referred to as the annual salary), the number of New Employees, as well as the number of Departure Employees (employees who left).

Employee retention rate comparison report
It is possible to compare data only for employees who left, compared to the total current employees, between two separate time periods. This is commonly referred to as the employee retention rate.
To view these metrics, first open the Employee Analysis report by navigating to . Click the (Pivot) icon in the upper-right corner to view the information in a pivot table.
Next, click the Measures button in the upper-left corner, revealing a drop-down menu. Click # New Employees, Annual Employee Budget, Fuel Card, and Wage in the list, to deselect these metrics and hide them in the table. Then, click Count at the bottom of the list to enable that metric.
Click away from the drop-down menu to close it. Now, the report shows all the employees who left the company (# Departure Employee), as well as the total number of employees (Count), for the Last 365 Days.
หากต้องการเปรียบเทียบข้อมูลของปีปัจจุบันกับปีที่แล้ว ให้คลิก (ลูกศรชี้ลง) ในแถบค้นหา เพื่อแสดงตัวเลือกตัวกรองและการจัดกลุ่มต่างๆ คลิก 365 วันที่ผ่านมา ในคอลัมน์ ตัวกรอง เพื่อปิดตัวกรองดังกล่าว จากนั้นคลิก วันที่ และคลิกปีปัจจุบัน (ในตัวอย่างนี้ คือ 2024) จากเมนูแบบเลื่อนลงที่ปรากฏขึ้น
Once a selection is made beneath Date in the Filters column, a Comparison column appears. Click Date: Previous Year in the new column, then click off of the drop-down menu to close it.
Note
In Odoo, in order to access the Comparison column, a specific time other than Last 365 Days must be selected. If not, the Comparison column is not visible.
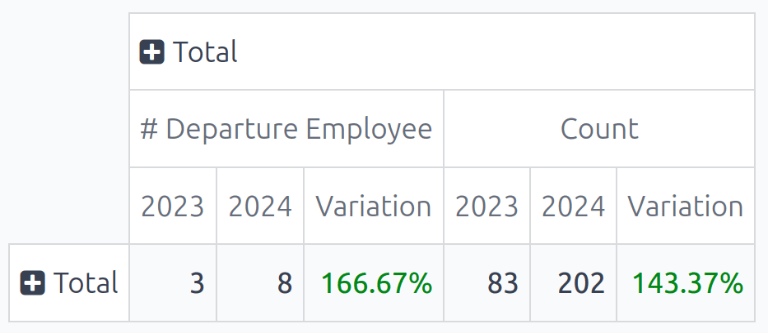
Now, the pivot table displays the total number of employees who left the company (# Departure Employee), as well as the total number of employees (Count) in the columns. These are further divided by the two different years, and also displays the Variation between the two.
The rows display the departments, and lists each individual employee for each department, in the rows.
หากต้องการดูรายงานนี้ให้กระชับยิ่งขึ้น ให้คลิก ทั้งหมด เหนือแถวบนสุดของแผนกและพนักงาน เพื่อยุบแถวเหล่านั้น จากนั้น ตารางจะแสดงจำนวนพนักงานทั้งหมดที่ลาออกจากบริษัทในทั้งสองปี เปรียบเทียบกับจำนวนพนักงานทั้งหมดในทั้งสองปี รวมถึงส่วนต่าง โดยแสดงเป็นเปอร์เซ็นต์
Example
ในตัวอย่างนี้ พนักงาน 3 จาก 83 ลาออกในปี 2023 และพนักงาน 8 จาก 202 ลาออกในปี 2024 มีพนักงานที่ลาออกในปี 2024 เพิ่มขึ้น 166.67% เมื่อเทียบกับปี 2023 นอกจากนี้ จำนวนพนักงานทั้งหมดในปี 2024 เพิ่มขึ้น 143.37% เมื่อเทียบกับปี 2023

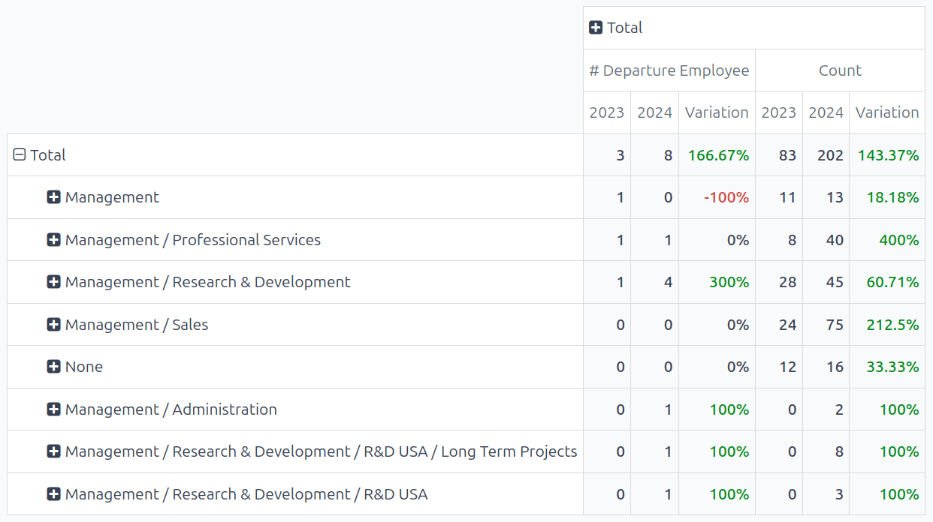
หากต้องการดูรายละเอียดอัตราค่าจ้างของแต่ละแผนก ให้คลิก ทั้งหมด ในแถวเดียว ซึ่งจะแสดงเมนูแบบเลื่อนลง จากนั้นคลิก แผนก คลิกออกจากเมนูแบบเลื่อนลงเพื่อปิด จากนั้นตารางสรุปจะแสดงจำนวนพนักงานทั้งหมดที่ลาออก (# พนักงานที่ลาออก) จำนวนพนักงานทั้งหมด (Count) และ การเปลี่ยนแปลง (เป็นเปอร์เซ็นต์) สำหรับทั้งปี 2023 และ 2024 โดยจัดตามแผนก
Example
In this example, it can be determined that the Management department had the best retention rate in 2024 as compared to 2023, with a Variation rate of -100%. Additionally, it can be determined that the Management / Research & Development department had the most turnover, with a Variation of 300%.
