Recruitment analysis
The Recruitment Analysis report allows recruiting departments to see which job positions have the most applicants, which have the most referrals, and how long it takes for applicants to move through the pipeline.
Informațiile despre numărul de candidați pentru fiecare post, precum și statistici despre câți au fost angajați sau refuzați, pot oferi perspective valoroase. Aceste date pot ajuta echipa de recrutare să își adapteze strategiile pentru a atrage cei mai buni candidați.
Recruitment analysis report
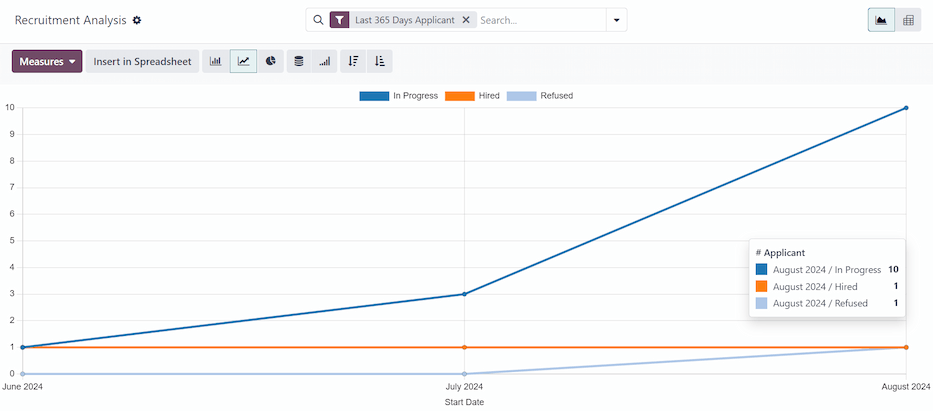
Start by navigating to . This presents a line chart of all applicants for the last year.
Sunt prezentate trei metrici distincte, codate pe culori: În desfășurare, Angajat și Refuzat.
Plasați cursorul peste o lună din grafic și va apărea o fereastră pop-up cu valorile specifice pentru acea lună.
Vizualizare tabel pivot
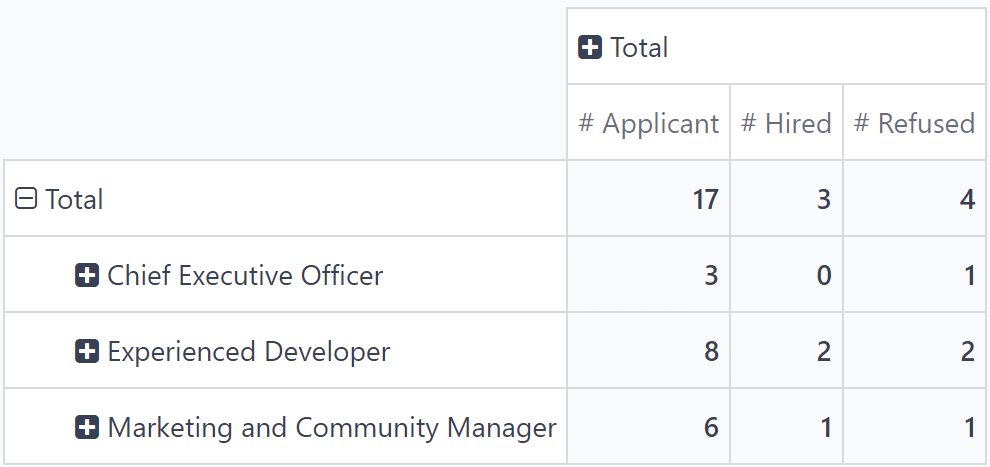
For a more detailed view of the information in the Recruitment Analysis report, click the (Pivot) icon in the top-right corner. This displays all the information in a pivot table.
In this view, the job positions are displayed in the rows, and the columns display the total numbers of applicants, including how many of those applicants were hired or refused. The displayed information can be modified, if desired.
In this example, there are 17 total applicants. Out of that, three have been hired, and four refused. The Experienced Developer position has eight total applicants, two of which were hired, and two were refused.
Caz de utilizare: candidați cu recomandări
To get a better understanding of how effective the company’s referral program is, the Recruitment Analysis report can be modified to show how many applicants were referred by current employees.
From the (Pivot) view of the Recruitment Analysis report, first click the Measures button to reveal a drop-down menu of options.
Click both Has Referrer and Count, to activate those two measures. Then, click # Applicant, # Hired, and # Refused to deactivate those default measures.
Acum, coloana afișează numărul de candidați care provin din recomandări în coloana Are recomandator și numărul total de candidați în coloana Număr.

In this example, the Experienced Developer job position has the most applicants from referrals. Out of the eight applicants, six have applied through a referral from a current employee. Meanwhile, the Marketing and Community Manager job position has the least amount of referrals out of the total applicants, only one out of six.
Angajați prin recomandări
Este posibil să modificați acest raport pentru a vedea câți candidați recomandați au fost angajați.
Pentru a vedea aceste date, faceți clic pe un rând [post], care va deschide un meniu derulant. Apoi, faceți clic pe Stare pentru a afișa stările actuale ale candidaților.
Notă
Doar stările care au candidați sunt afișate pentru fiecare post. Dacă o stare nu are candidați, nu va apărea în listă.
Pentru a extinde celelalte rânduri și a afișa diferitele stări, faceți clic pe butonul [post].
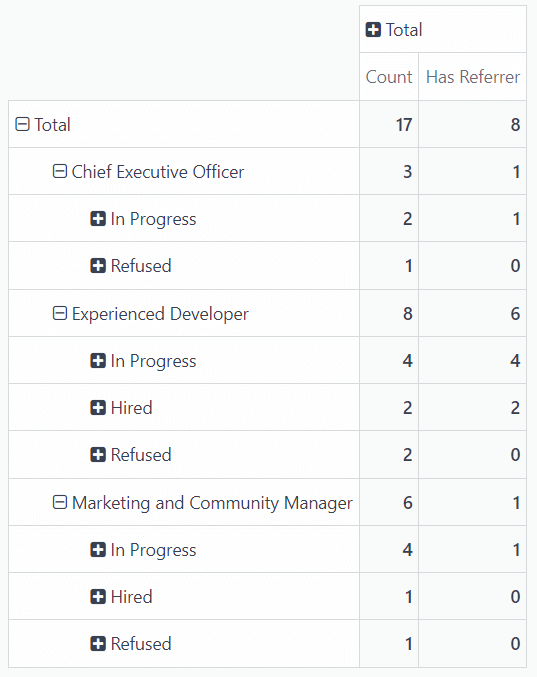
In this example, the Experienced Developer job position is the most successful in terms of referrals. Both of the hired employees came from internal referrals. Meanwhile, there have been no hired employees for the Chief Executive Officer position, and the only hired employee for the Marketing and Community Manager was not referred by an employee.
In this scenario, it is possible to determine that the current software developers are providing the most referrals, with the highest success rate.