Records zoeken, filteren en groeperen
Odoo allows for the searching, filtering, and grouping of records in a view to display only the most relevant records. The search bar is located at the top of the view, start typing to search for values, or click the 🔽 (down arrow) icon to access the Filter, Group By, and Favorites drop-down menus.
Waarden zoeken
Use the search field to quickly look for specific values, and add them as a filter. Type the value to search for, and select the desired option from the drop-down menu to apply the search filter.
Example
Instead of adding a custom filter to select records where
Mitchell Admin is the salesperson on the Sales Analysis report (), search for Mitch, and click the ⏵ (right arrow) next to
Search Salesperson for: Mitch, and select Mitchell Admin.

Notitie
Using the search field is equivalent to using the contains operator when adding a custom filter. If a partial value is entered, and the desired field is directly selected (without selecting the ⏵ (right arrow)), all records containing the typed characters for the selected field are included.
Filters
Filters worden gebruikt om records te selecteren die aan specifieke criteria voldoen. De standaardselectie van records is specifiek voor elke weergave, maar kan worden aangepast door een (of meerdere) voorgeconfigureerde filters te selecteren, of door een aangepaste filter toe te voegen.
Vooraf geconfigureerde filters
Modify the default selection of records by clicking the 🔽 (down arrow) icon from the search bar, and selecting one (or several) preconfigured filters from the Filters drop-down menu.
Example
Op het rapport Verkoopanalyse () worden standaard alleen records geselecteerd die zich in de fase verkooporder bevinden, met een orderdatum binnen de laatste 365 dagen.
Om ook records in de fase offerte op te nemen, selecteer je Offertes uit de Filters.
Furthermore, to only include sales order and quotation records from a specific year, like
2024, for example, first remove the existing Order Date: Last 365 Days filter, by clicking the
❌ (remove) icon, then select .

Notitie
De vooraf geconfigureerde Filters zijn gegroepeerd en elke groep wordt gescheiden door een horizontale lijn. Het selecteren van vooraf geconfigureerde filters uit dezelfde groep zorgt ervoor dat records voldoen aan minstens een van de toegepaste voorwaarden. Het selecteren van filters uit verschillende groepen vereist echter dat records voldoen aan alle toegepaste voorwaarden.
Aangepaste filters
If the preconfigured filters are not specific enough, add a custom filter. To do so, click the 🔽 (down arrow) icon in the search bar, then select .
Het pop-upvenster Aangepaste filter toevoegen toont de matchoptie, filterregel en een schakelaar om gearchiveerde records ook op te nemen.

De standaard matchingconfiguratie is Match een van onderstaande regels, wat aangeeft dat elke filterregel onafhankelijk wordt toegepast. Om de matchingconfiguratie te wijzigen naar Match alle onderstaande regels, moeten er ten minste twee filterregels worden toegevoegd aan de aangepaste filter.
Match all 🔽 of the following rules: all of the filter rules must be met. Logically, this is an AND (
&) operation.Match any 🔽 of the following rules: any of the filter rules can be met. Logically, this is an OR (
|) operation.
Standaard wordt er één filterregel toegevoegd aan de aangepaste filter. Hieronder beschrijven we de structuur van een filterregel:
The first inline field is the field name to filter by. Some fields have refined parameters that are nested within another field. These fields have an > (arrow) icon beside them, which can be selected to reveal the nested fields.
Het tweede inline veld is de voorwaardelijke operator die gebruikt wordt om de veldnaam te vergelijken met de waarde. De beschikbare voorwaardelijke operators zijn specifiek voor het gegevenstype van het veld.
Het derde inline veld is de variabele waarde van de veldnaam. De waarde-invoer kan verschijnen als een vervolgkeuzemenu, een tekstinvoer, een nummerinvoer, een datum/tijd-invoer, een booleaanse selector, of het kan leeg zijn, afhankelijk van de gebruikte operator en het gegevenstype van het veld.
Rechts naast de filtercirteria zijn nog drie knoppen beschikbaar:
➕ (plus sign): adds a new rule below the existing rule.
(Add branch): adds a new group of rules below the existing rule, with the any and all matching options available to define how each rule within this branch is applied to the filter. If the matching option is set to the same as the parent group, the fields are moved to join the parent group.
Example
If the matching option is set to Match all 🔽 of the following rules, and a new branch is added with its matching option changed from any 🔽 of to all 🔽 of, the newly-added branch disappears, and its group of rules are moved to the parent group.
🗑️ (garbage can): deletes the node. If a branch node is deleted, all children of that node are deleted, as well.
Je kunt een nieuwe filterregel toevoegen aan de aangepaste filter door op de knop Nieuwe regel te klikken.
Zodra de filtercriteria zijn gedefinieerd, klik je op Toevoegen om de aangepaste filter aan de weergave toe te voegen.
Example
Om alle leads en verkoopkansen uit de -app te zoeken die in de fase Gewonnen zitten en een verwachte omzet hebben van meer dan $1.000, moet het volgende worden ingevoerd:
Match all 🔽 (down arrow) of the following rules:
Fase is in Gewonnen
Verwachte Omzet >
1,000een 🔽 (pijl omlaag) van:
Type = Lead
Type = Verkoopkans

Tip
Activeer Ontwikkelaarsmodus (debugmodus) om de technische naam en het gegevenstype van elk veld te onthullen, evenals het tekstvak Code editor onder de filterregels, om het domein handmatig te bekijken en te bewerken.
Records groeperen
The display of records in a view can be clustered together, according to one of the preconfigured groups. To do so, click the 🔽 (down arrow) icon in the search bar, then select one of the Group By options from the drop-down menu.
Example
Om de records te groeperen per verkoper in het Verkoopanalyse-rapport (), klik je op de optie Verkoper onder Groeperen op. De weergave verandert om de records per verkoper te groeperen, zonder records weg te filteren.

Je kunt ook een aangepaste groep gebruiken, een veld dat aanwezig is in het model. Klik hiervoor op en selecteer een veld uit het vervolgkeuzemenu.
Notitie
Je kunt meerdere groepen tegelijkertijd gebruiken. De eerste groep die wordt geselecteerd is de hoofdcluster, de volgende die wordt toegevoegd verdeelt de categorieën van de hoofdgroep verder, enzovoort. Bovendien kunnen filters en groepen samen worden gebruikt om de weergave nog verder te verfijnen.
Vergelijking
Certain reporting dashboards include a Comparison section in the drop-down menus of their Search… bars. This includes the Overall Equipment Effectiveness report for the Manufacturing app, and the Purchase report for the Purchase app, among others.
The options in the Comparison section are used to compare data from two different time periods. There are two comparison options to choose from: (Time Filter): Previous Period and (Time Filter): Previous Year.
Belangrijk
For some reports, the Comparison section only appears in the Search… bar drop-down menu if one (or more) time periods have been selected in the Filters column. This is because, if no time period is specified, there is nothing to compare.
Additionally, some reports only allow use of the Comparison feature when the (pie chart) graph type, or the (pivot) view, is selected. A Comparison option can be selected even if another view is enabled, but doing so does not change the way data is displayed on the report.

To view data using one of the two comparisons, begin by selecting a time period in the Filters column of the Search… bar drop-down menu. Then, select either (Time Filter): Previous Period or (Time Filter): Previous Year in the Comparison section.
Met een van de Vergelijking-opties ingeschakeld, vergelijkt het rapport de gegevens voor de geselecteerde periode met de gegevens voor dezelfde tijdseenheid (maand, kwartaal, jaar), één periode of jaar eerder. De manier waarop de gegevens worden weergegeven hangt af van de geselecteerde weergave:
The (bar chart) shows two bars, side-by-side, for each unit of time for the selected time period. The left bar represents the selected time period, while the right bar represents the previous time period.
The (line chart) is displayed with two lines, one representing the selected time period, and the other representing the previous time period.
The (pie chart) appears as a large circle with a smaller circle inside. The larger circle represents the selected time period, while the smaller circle represents the previous time period.
The (pivot table) is displayed with each column split into two smaller columns. The right column represents the selected time period, while the left column represents the previous time period.
Example
In the Production Analysis report of the app, data for the second quarter of 2024 is compared to data for the second quarter of 2023. Q2 is selected in the End Date filter section of the Search… bar drop-down menu. In the Comparison section, End Date: Previous Year is selected.
Het huidige jaar is 2024, dus de grotere cirkel toont gegevens voor het tweede kwartaal (Q2) van 2024. De kleinere cirkel toont gegevens voor het tweede kwartaal (Q2) van 2023, wat dezelfde periode is, maar een jaar eerder.
Als in plaats daarvan Einddatum: Vorige periode is geselecteerd, toont de kleinere cirkel gegevens voor het eerste kwartaal (Q1) van 2024, wat dezelfde tijdsperiode is, maar één periode eerder.

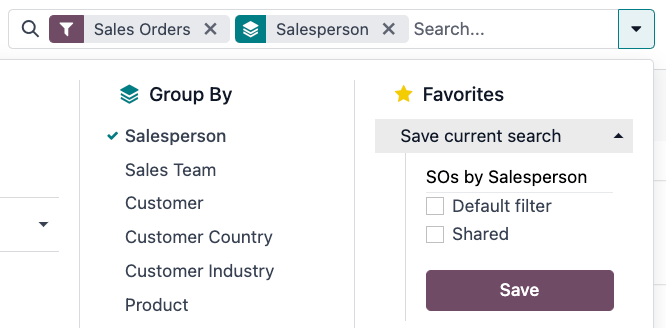
Favorieten
Met favorieten kun je een specifieke zoekopdracht opslaan voor toekomstig gebruik, of als nieuwe standaardfilter voor de weergave.
To save the current view as a favorite, click the 🔽 (down arrow) icon in the search bar, then select the Save current search drop-down menu to display the following options:
Filter name: name of the favorited search.
Default filter: sets the favorited search as the default filter for the view.
Shared: makes the favorited search available to all users. By default, the favorited search is only available to the user who created it.
Zodra deze opties zijn ingesteld, klik je op Opslaan om de favoriete zoekopdracht op te slaan.
Saved favorites can be accessed by clicking the 🔽 (down arrow) icon in the search bar, then selecting the saved filter in the Favorites drop-down menu. To remove a saved favorite, click the 🗑️ (garbage can) icon next to the favorited search.
Tip
To view all favorited searches, first activate Ontwikkelaarsmodus (debugmodus), and navigate to . From here, all favorited searches can be viewed, edited, archived, or deleted.