Raportare
Odoo Helpdesk includes several reports that provide the opportunity to track trends for customer support tickets, identify areas for improvement, manage employee workloads, and confirm when customer expectations are met.
Rapoarte disponibile
Details about the reports available in Odoo Helpdesk can be found below. To view the different reports, go to .
Analiză tichet
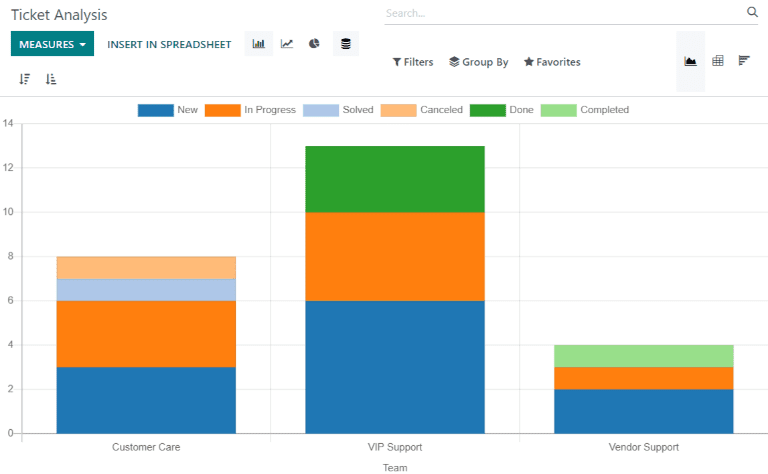
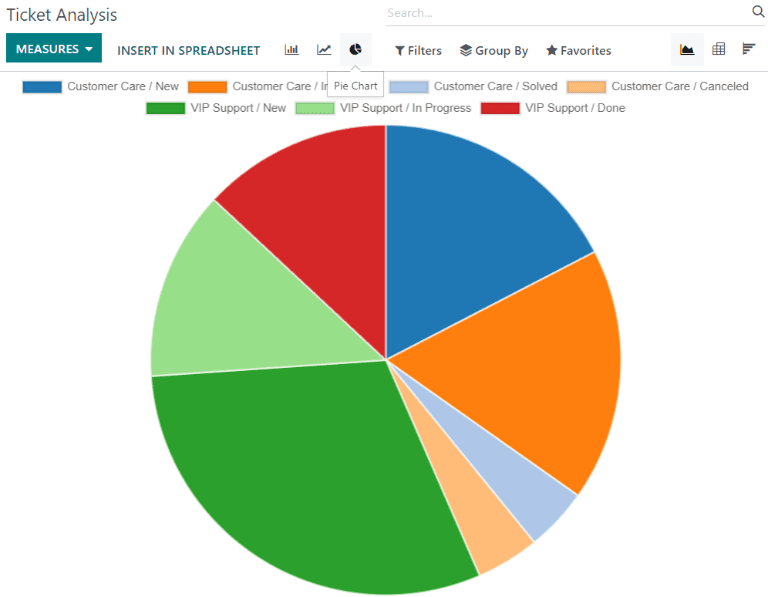
The Ticket Analysis report () provides an overview of every customer support ticket in the database. This includes the number of tickets assigned among teams and individual users.
This report is useful in identifying where teams are spending the most time, and helps determine if there is an uneven workload distribution among the support staff. The default report counts the number of tickets per team and groups them by stage.
Pot fi selectate măsuri alternative pentru a urmări unde se petrece cel mai mult timp în diferite puncte ale fluxului de lucru. Pentru a modifica măsurile utilizate pentru raportul care este afișat în prezent sau pentru a adăuga mai multe, faceți clic pe butonul Măsuri și selectați una sau mai multe opțiuni din meniul derulant:
Average Hours to Respond: average number of working hours between a message sent from the customer and the response from the support team. This is does not include messages sent when the ticket was in a folded stage
Hours Open: number of hours between the date the ticket was created and the closed date. If there is no closed date on the ticket, the current date is used. This measure is not specific to working hours
Hours Spent: number of Timesheet hours logged on a ticket. This measure is only available if Timesheets are enabled on a team, and the current user has the access rights to view them
Hours to Assign: number of working hours between the date on which the ticket was created and when it was assigned to a team member
Hours to Close: number of working hours between the date on which the ticket was created and the date it was closed
Hours to First Response: number of working hours between the date on which the ticket was received and the date one which the first message was sent. This does not include email sent automatically when a ticket reaches a stage
Hours to SLA Deadline: number of working hours remaining to reach the last SLA deadline on a ticket
Rating /5: number valued assigned to the rating received from a customer (Dissatisfied = 1, Okay/Neutral = 3, Satisfied = 5)
Count: number of tickets in total
Notă
Orele de lucru sunt calculate pe baza calendarului de lucru implicit. Pentru a vizualiza sau modifica calendarul de lucru, accesați aplicația și selectați .
Stare Analiză SLA
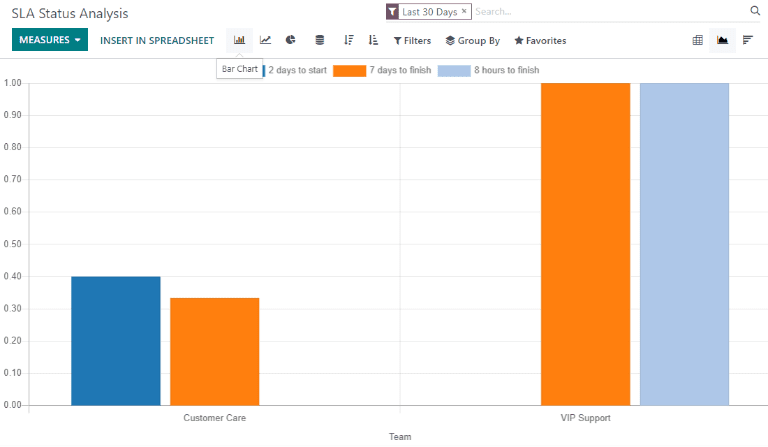
The SLA Status Analysis report () tracks how quickly an SLA (Service Level Agreement) is fulfilled, as well as the success rate of individual policies.
By default, this report is filtered to show the number of SLAs failed, as well as the failure rate over the last 30 days, grouped by team.

Pentru a modifica măsurile utilizate pentru raportul care este afișat în prezent sau pentru a adăuga mai multe, faceți clic pe butonul Măsuri și selectați una sau mai multe opțiuni din meniul derulant:
% of Failed SLA: percentage of tickets that have failed at least one SLA
% of SLA in Progress: percentage of tickets that have at least one SLA still in progress, and have not failed any SLAs
% of Successful SLA: percentage of tickets where all SLAs have been successful
Number of SLA Failed: number of tickets that have failed at least one SLA
Number of SLA Successful: number of tickets where all SLAs have been successful
Number of SLA in Progress: number of tickets that have at least one SLA still in progress, and have not failed any SLAs
Working Hours to Assign: number of working hours between the date on which the ticket was created and when it was assigned to a team member
Working Hours to Close: number of working hours between the date on which the ticket was created and the date it was closed
Working Hours to Reach SLA: number of working hours between the date on which the ticket was created and the date the SLA was satisfied
Count: number of tickets in total
Example
To see the number of tickets that were able to achieve the stated SLA objectives, and track the amount of time it took to achieve those objectives, click and .
To sort these results by the team members assigned to the tickets, select .
Vedeți și
Evaluări client
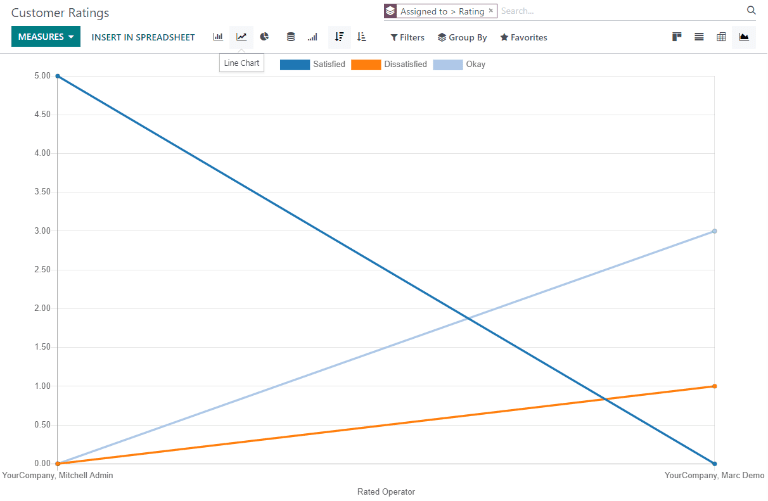
The Customer Ratings report () displays an overview of the ratings received on individual support tickets, as well as any additional comments submitted with the rating.
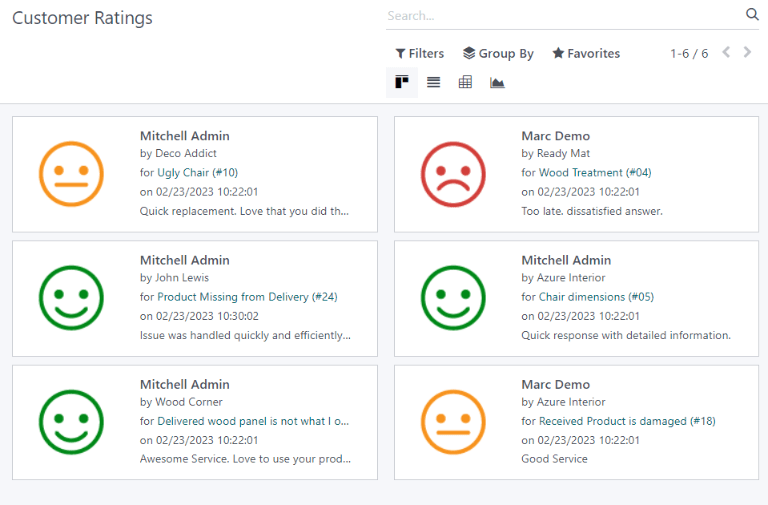
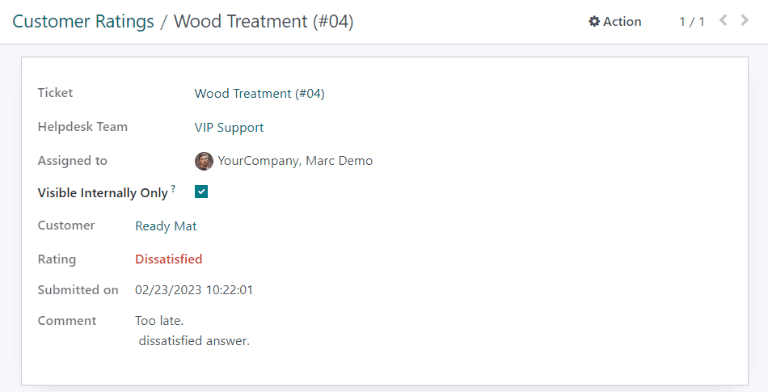
Faceți clic pe o evaluare individuală pentru a vedea detalii suplimentare despre evaluarea trimisă de client, inclusiv un link către biletul original.
Sfat
On the rating’s details page, select the Visible Internally Only option to hide the rating from the customer portal.
The Customer Ratings report is displayed in a kanban view by default, but can also be displayed in graph, list, or pivot view.
Vedeți și
Opțiuni de vizualizare și filtrare
În orice raport Odoo, opțiunile de vizualizare și filtrare variază, în funcție de datele care sunt analizate, măsurate și grupate. Consultați mai jos informații suplimentare despre vizualizările disponibile pentru rapoartele Helpdesk.
Notă
Numai o singură măsură poate fi selectată la un moment dat pentru grafice, dar tabelele pivot pot include mai multe măsuri.
Vedere pivot
Vizualizarea pivot prezintă datele într-o manieră interactivă. Toate cele trei rapoarte Helpdesk sunt disponibile în vizualizarea pivot.
The pivot view can be accessed on any report by selecting the grid icon at the top right of the screen.
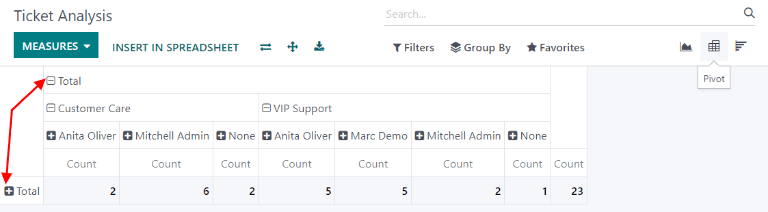
Pentru a adăuga un grup la un rând sau o coloană la vizualizarea pivot, faceți clic pe ➕ (semnul plus) de lângă Total, apoi selectați unul dintre grupuri. Pentru a elimina unul, faceți clic pe ➖ (semnul minus) și deselectați opțiunea corespunzătoare.
Vedere grafică
Vizualizarea grafic prezintă datele fie într-o diagramă cu bare, linie, fie într-o diagramă *pietrată.
Switch to the graph view by selecting the line chart icon at the top right of the screen. To switch between the different charts, select the related icon at the top left of the chart, while in graph view.
Sfat
Both the bar chart and line chart can utilize the stacked view option. This presents two (or more) groups of data on top of each other, instead of next to each other, making it easier to compare data.
Salvați și partajați o căutare preferată
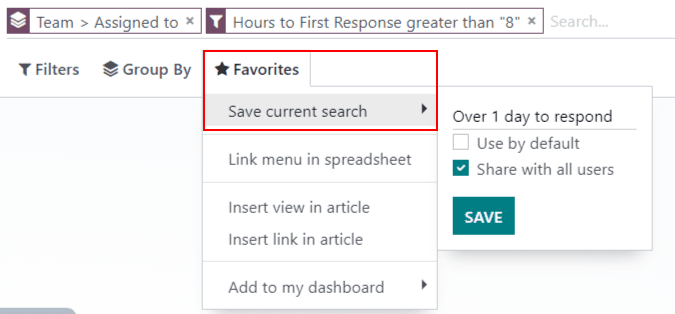
The Favorites feature found on Helpdesk reports allows users to save their most commonly used filters without having to reconstruct them every time they are needed.
To create and save new Favorites on a report, follow the steps below:
Setați parametrii necesari folosind opțiunile Filters, Group By și Measures.
Click .
Redenumiți căutarea.
Select Use by default to have these filter settings automatically displayed when the report is opened. Otherwise, leave it blank.
Select Share with all users to make this filter available to all other database users. If this box is not checked, it will only be available to the user who creates it.
Faceți clic pe Salvați pentru a păstra configurația pentru utilizare ulterioară.
Vedeți și