Reporting
Reports in Odoo Helpdesk provide the opportunity to manage employee workloads, identify areas for improvement, and confirm if customer expectations are being met.
Available reports
Details about the reports available in Odoo Helpdesk can be found below. To view the different reports, go to , and select one of the following: Tickets Analysis, SLA Status Analysis, or Customer Ratings.
Tickets Analysis
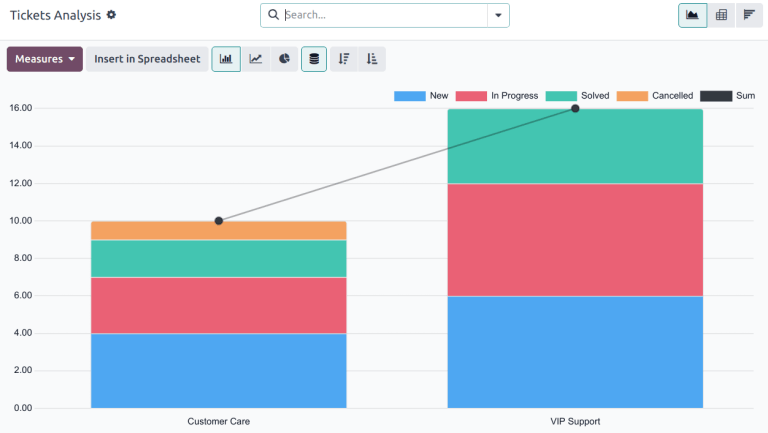
The Tickets Analysis report () provides an overview of every customer support ticket in the database.
This report is useful for identifying where teams are spending the most time, and helps determine if there is an uneven workload distribution among the support staff. The default report counts the number of tickets per team and groups them by stage.
Alternative measures can be selected to track where the most time is spent at different points in the workflow. To change the measures used for the report that is currently displayed, or to add more, click the Measures button, and select one or more options from the drop-down menu:
Average Hours to Respond: average number of working hours between a message sent from the customer and the response from the support team. This does not include messages sent when the ticket was in a folded stage.
Hours Open: number of hours between the date the ticket was created and the closed date. If there is no closed date on the ticket, the current date is used. This measure is not specific to working hours.
Hours Spent (Timesheets): number of Timesheet hours logged on a ticket. This measure is only available if Timesheets are enabled on a team, and the current user has the access rights to view them.
Hours to First Response: number of working hours between the date the ticket was received and the date on which the first message was sent. This does not include email sent automatically when a ticket reaches a stage.
Rating (1-5): number out of five to represent customer feedback (Dissatisfied = 1, Okay/Neutral = 3, Satisfied = 5).
Remaining Hours on SO: hours remaining on a linked sales order.
Working Hours to Assign: number of working hours between the date the ticket was created and when it was assigned to a team member.
Working Hours to Close: number of working hours between the date the ticket was created and the date it was closed.
Working Hours until SLA Deadline: number of working hours remaining to reach the last SLA deadline on a ticket.
Count: number of tickets in total.
Note
Working hours are calculated based on the default working calendar. To view or change the working calendar, go to the application and select .
SLA Status Analysis
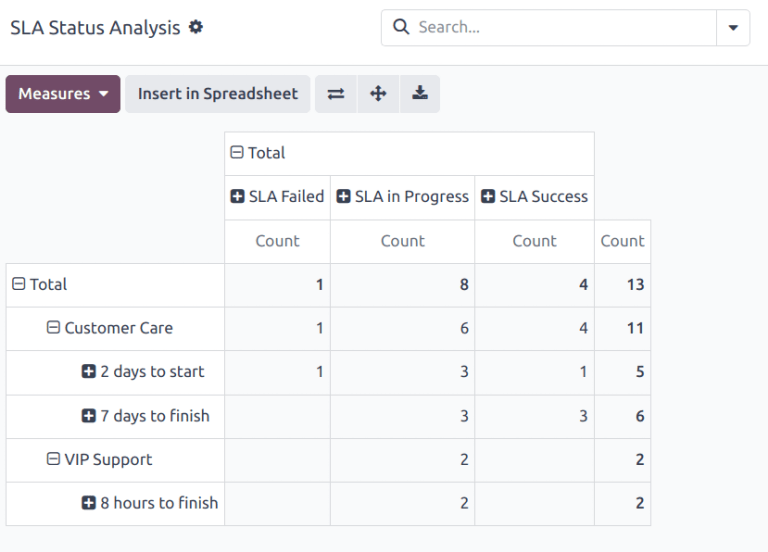
The SLA Status Analysis report () analyzes the performance of individual SLA (Service Level Agreement) policies.
By default, this report is filtered to show the number of SLAs failed, in progress, and the number that have been successful. The results are grouped by teams.
To change the measures used for the report that is currently displayed, or to add more, click the Measures button, and select one or more options from the drop-down menu:
Average Hours to Respond: average number of working hours between a message sent from the customer and the response from the support team. This does not include messages sent when the ticket was in a folded stage.
Hours Open: number of hours between the date the ticket was created and the closed date. If there is no closed date on the ticket, the current date is used. This measure is not specific to working hours.
Hours Spent (Timesheets): number of Timesheet hours logged on a ticket. This measure is only available if Timesheets are enabled on a team, and the current user has the access rights to view them.
Hours to First Response: number of working hours between the date the ticket was received and the date on which the first message was sent. This does not include email sent automatically when a ticket reaches a stage.
Number of SLA Failed: number of tickets that have failed at least one SLA.
Rating (1-5): number value representing customer feedback (Dissatisfied = 1, Okay/Neutral = 3, Satisfied = 5).
Remaining Hours on SO: hours remaining on a linked sales order.
Working Hours to Assign: number of working hours between the date the ticket was created and when it was assigned to a team member.
Working Hours to Close: number of working hours between the date the ticket was created and the date it was closed.
Working Hours to Reach SLA: number of working hours between the date the ticket was created and the date the SLA was satisfied.
Count: number of tickets in total.
See also
Customer Ratings
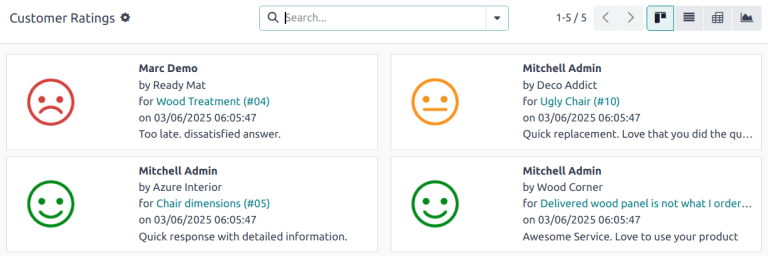
The Customer Ratings report () displays an overview of the ratings received on individual support tickets, as well as any additional comments submitted with the rating.
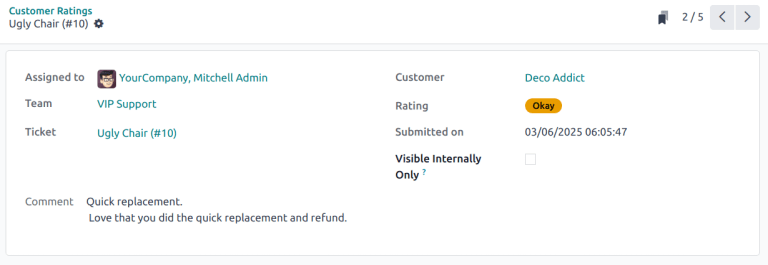
Click on an individual rating to see additional details about the rating submitted by the customer, including a link to the original ticket.
Tip
On the rating’s details page, tick the Visible Internally Only checkbox to hide the rating from public and portal users.
The Customer Ratings report is displayed in a Kanban view by default, but can also be displayed in graph, list, or pivot view.
See also
Use cases
Assessing performance based on customer priority
The Tickets Analysis report can be used to evaluate the time it takes to address high-priority tickets compared to standard ones. This helps ensure that high-priority tickets are resolved promptly, and identifies any discrepancies in response times based on priority.
First, navigate to . Click Measures, then select Working Hours to Close. Click into the search bar, then under Group By, select Priority. Finally, under Filters, select Closed.
Tip
The pivot view is also useful for this version of the report.
Monitoring SLA compliance over time
The SLA Status Analysis report can be used to track SLA compliance trends to identify periods with higher SLA breaches. SLA breaches happen when support teams fail to meet the response or resolution times promised in SLAs, leading to dissatisfied customers, potential financial penalties, and decreased team morale. Identifying these breaches is crucial for tracking real-time performance, uncovering patterns, and addressing root causes—like staffing issues or process inefficiencies.
First, navigate to . Click the (Graph) icon, then the (Line Chart) icon.
Note
While the SLA Status Analysis report defaults to the pivot view, the line chart view provides a better visual representation for this specific use case.
Click Measures, then select Number of SLAs Failed. Doing so ensures the data on the report shows only information for tickets that failed at least one SLA. Click into the search bar, then under Group By, select SLA Deadline, and select a time frame, either Month, Week, or Day. This option shows when the highest number of tickets with SLAs are failing, allowing the team to identify patterns, and prepare for potential issues.
Tip
The time frame selected for this report may vary depending on a few factors, including the amount of tickets received on a regular basis, the number of SLAs enabled in the database, and the workload of the team. It is worth experimenting to see what option delivers the most insights.
See also