Pipeline Analysis
The CRM app manages the sales pipeline as leads and opportunities move from stage to stage, ultimately being either won or lost. After organizing the pipeline, the search options and reports available on the Pipeline Analysis page can be used to gain insight into the effectiveness of campaigns, salespeople, and more.
Note
The CRM app supports using leads as an intermediate qualifying step before creating a formal opportunity. For the purposes of this article, the term opportunity is used, but the information applies to leads as well. This article assumes leads have been enabled in the CRM app’s configuration settings.
Pipeline analysis reports
To view the Pipeline Analysis page, go to . A stacked bar chart showcasing all opportunities created during the current year automatically loads. The bars represent the number of opportunities currently in each stage of the sales pipeline, color-coded to show the month the opportunity reached that stage.
The interactive elements of the Pipeline Analysis page manipulate the graph to report different metrics in different views. View options are in the upper-right corner.
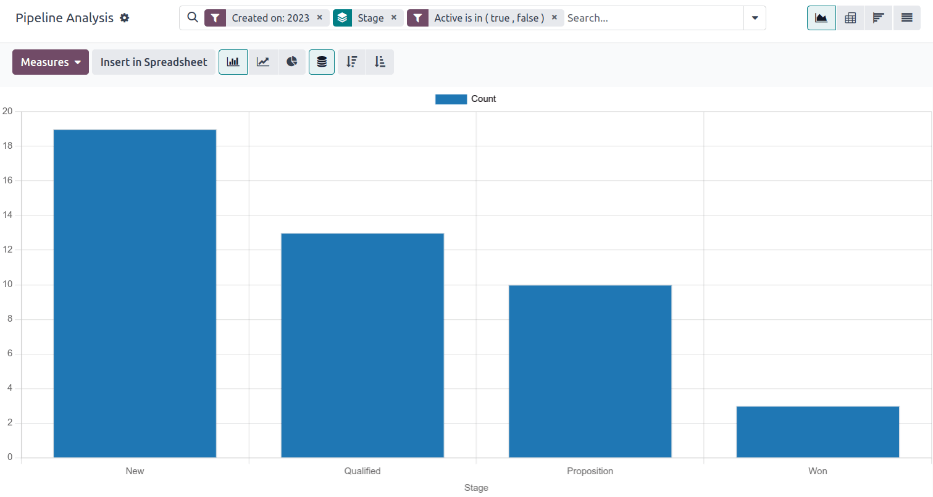
Graph view: Displays the total number of opportunities in a bar graph, allowing for quick visual comparisons of opportunities across CRM stages. This is the default view.
Pivot view: Displays the detailed Expected Revenue by both stage and month in a customizable table. This can be modified to display information into more detailed categories, such as salesperson, campaign, and more.
Cohort view: Displays and organizes the data based on their Created on and Closed Date day, week, month, quarter, or year. This allows for easy identification of patterns over certain time periods. Week is the default setting.
List view: Displays the opportunities in a detailed list, allowing for easy viewing of detailed individual records.
Filters and groupings
The Pipeline Analysis page can be customized with various filters and grouping options.
Filters
The Filters section allows users to add pre-made and custom filters to the search criteria. Multiple filters can be added to a single search.
My Pipeline: Show opportunities assigned to the current user.
Active: Show active opportunities. Active opportunities are those that appear in the CRM pipeline as Ongoing or Rotting.
Inactive: Show inactive opportunities. Inactive opportunities are those that appear in the CRM pipeline as Lost, Won, and Archived.
Won: Show opportunities that have been marked Won.
Lost: Show opportunities that have been marked Lost.
Created on: Show opportunities that were created during a specific period of time. The default time period is the current year, but it can be adjusted as needed.
Expected Closing: Show opportunities that are projected to close during a specific period of time. Closed opportunities are marked as having been Won.
Date Closed: Show opportunities that have been marked Won during a specific period of time.
Archived: Show opportunities that have been archived. Lost opportunities are automatically archived, but not all archived opportunities are marked as Lost.
Custom Filter: Allows the user to create a custom filter with numerous options.
Additionally, the following options appear if the Opportunities option has been enabled in the CRM app’s Configuration settings.
Opportunities: Show leads that have been qualified as opportunities.
Leads: Show leads that have yet to be qualified as opportunities.
Groupings
The Group By section allows users to add pre-made and custom groupings to the search results. Multiple groupings can be added to split results into more manageable chunks. The order of the selected groupings determines how results are displayed, as each grouping is applied in sequence.
Tip
The CRM app uses the features of the Marketing Automation app for tracking campaign-related statistics. For more information about campaigns, mediums, and sources, see the Marketing Automation documentation.
Salesperson: Groups the results by the Salesperson to whom an opportunity is assigned.
Sales Team: Groups the results by the Sales Team to whom an opportunity is assigned.
City: Groups the results by the city from which an opportunity originated.
Country: Groups the results by the country from which an opportunity originated.
Company: Groups the results by the company to which an opportunity belongs, if multiple companies are activated in the database.
Stage: Groups the results by the stages of the sales pipeline.
Campaign: Groups the results by the marketing campaign from which an opportunity originated.
Medium: Groups the results by the medium (Email, Google Adwords, Website, etc.) from which an opportunity originated.
Source: Groups the results by the source (Search engine, Lead Recall, Newsletter, etc.) from which an opportunity originated.
Creation Date: Groups the results by the date an opportunity was added to the database.
Conversion Date: Groups the results by the date an opportunity was converted to an opportunity.
Expected Closing: Groups the results by the date an opportunity is expected to close. Closed opportunities are marked as having been Won.
Closed Date: Groups the results by the date an opportunity was marked Won.
Lost Reason: Groups the results by the reason selected when an opportunity was marked Lost.
Custom Group: Allows the user to create a custom group with numerous options.
Tip
Visit the Search, filter, and group records documentation for more information about custom filters and groups.
Measures
By default, the Pipeline Analysis page measures the total Count, or number of opportunities, for the current year. To change the displayed opportunities, click the Measures button in the top-left of the page and select one of the following options from the drop-down menu:
Days to Assign: Measures the number of days it took an opportunity to be assigned after creation.
Days to Close: Measures the number of days it took an opportunity to be closed. Closed opportunities are marked as having been Won.
Days To Convert: Measures the number of days it took an opportunity to be converted to an opportunity.
Exceeded Closing Days: Measures the number of days by which an opportunity exceeded its expected closing date.
Expected Revenue: Measures the expected revenue of an opportunity.
Prorated Revenue: Measures the prorated revenue of an opportunity.
Count: Measures the total amount of opportunities that match the search criteria.
If the Subscriptions app has been installed to the Odoo database, the following options also appear under Measures.
Expected MRR: Measures the expected monthly recurring revenue of an opportunity.
Prorated MRR: Measures the prorated monthly recurring revenue of an opportunity.
Prorated Recurring Revenues: Measures the prorated recurring revenues of an opportunity.
Recurring Revenues: Measures the recurring revenue of an opportunity.
Win/loss report
After understanding how to navigate the pipeline analysis page, the Pipeline Analysis page can be used to create and share different reports, such as win/loss reports.
Win/Loss reports are a calculation of active or previously active opportunities in a pipeline that were either marked as Won or Lost over a specific period of time. By calculating opportunities won vs. opportunities lost, win/loss reports can present different information for different needs. For example, a sales manager might find it useful to group wins and losses by salesperson or sales team to see who has the best conversion rate. A marketing team might group by sources or medium to determine where their advertising has been most successful.
A win/loss report for the current year, with results grouped by Stage, Won/Lost status, and Salesperson, allows managers to determine when leads and opportunities are lost or won, and which salespeople were handling them at the time.
To create the report, navigate to . On the Pipeline Analysis page, click the (Toggle Search Panel) icon at the end of the search bar to open a drop-down menu of filters and groupings. Under the Filters heading, ensure both Opportunities and Leads have been enabled to capture results for both.
Next, click Custom Filter… to bring up the Custom Filter pop-up window. Set the first field to Won/Lost, and set the last field to Won . Add another rule by clicking New Rule, and set the last field to Lost. Finally, enable the toggle Include archived in the top-right of the form, and click Search.
Important
Activating the Include archived toggle when creating win/loss reports guarantees that any archived Lost opportunities appear in the report. Without using the toggle or creating a rule that filters for both active and inactive opportunities, it’s possible for a report to not include lost opportunities even with the Lost filter active.
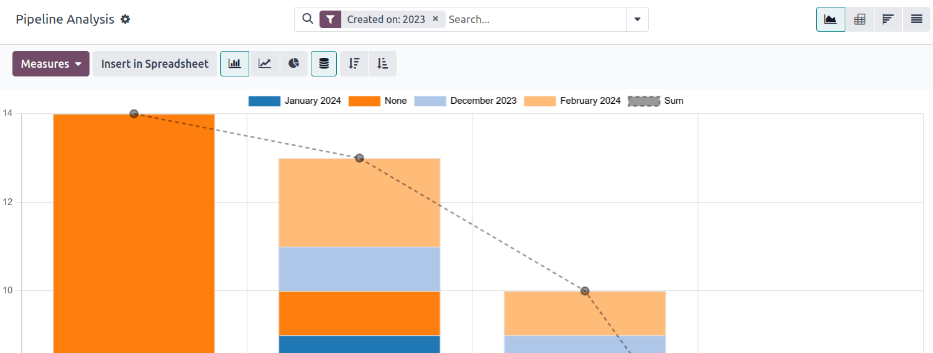
In the search bar, choose Stage under the Group By heading. Then click Custom Group and choose Won/Lost from the drop-down menu. Finally, activate the Salesperson option. By default, the data will appear with different results stacked on top of each other according to their stage. To view the bars in this chart side-by-side, deactivate the (Stacked) toggle.
Because options under the Group By heading are applied sequentially, this set-up ensures that the visual output for the report emphasizes the stage when opportunities were lost and then who was handling them when that occurred. Each column represents the number of opportunities in a stage that are assigned to a specific salesperson and won or lost. Clicking one of the columns opens a list view of the individual opportunities with won opportunities shown in bold and lost opportunities appearing greyed out.
Switching into other views after setting up this example report can help demonstrate the different use cases for those views.
Pivot view
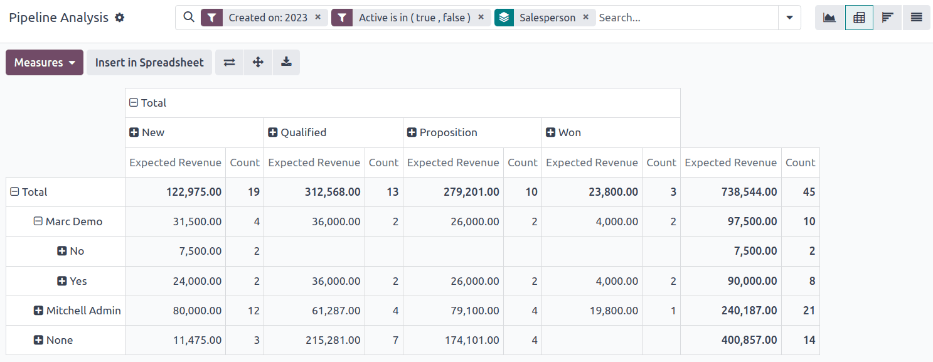
By default, the pivot view groups win/loss reports by Stage and measures Expected Revenue. The data on the pivot table can be adjusted by clicking the Measures button and choosing from the drop-down. Pivot tables make it especially easy to see the relationship between the chosen search filters and groupings and revenue.
Important
In pivot view, the Insert In Spreadsheet button may be greyed out due to the report containing duplicate grouping options. To fix this, remove the Stage grouping in the search bar.
Cohort view
By default, the cohort view groups win/loss reports by the dates they were Created on and Closed Date. The Cohort view makes it easy to identify productive and slow periods for businesses. The Cohort view does not support custom groupings of data.

List view
In list view, a win/loss report displays all opportunities on a single page. This view is useful for being able to see the details of opportunities while still having them grouped according to the chosen search filters and groupings.
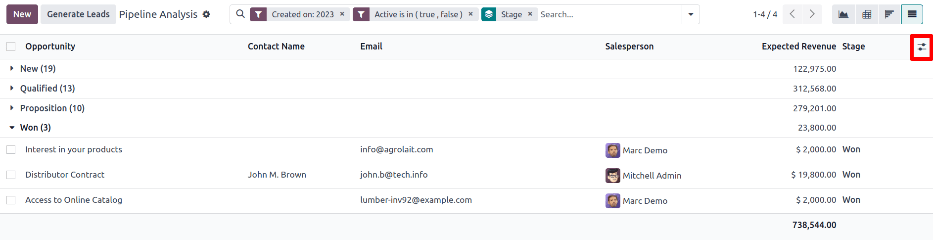
By default, the Opportunity, Contact Name, Email, Salesperson, Expected Revenue, and Stage columns are visible in this view. To add more columns to the list, click the icon in the top-right of the page. Select options from the resulting drop-down menu.