Employee retention report
It is possible to determine the retention rate for a company by modifying an existing report.
First, navigate to to open the Employee Analysis report. This report shows the number of all employees for the Last 365 Days, in a default Line Chart.
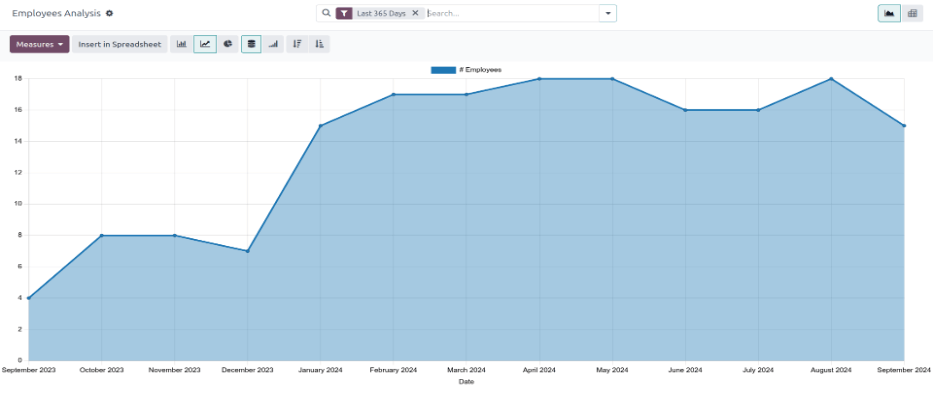
Next, click the Measures button in the upper-left corner, revealing a drop-down menu. Click # Departure Employee in the list, then click away from the drop-down menu to close it. Now, the report shows all the employees who were archived for the Last 365 Days.
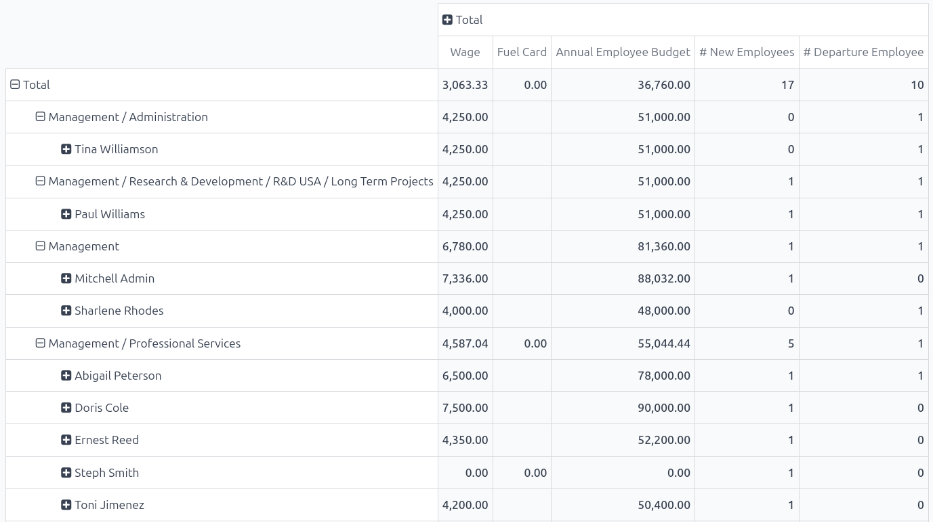
To view this information in an easier format, click the (Pivot) icon in the upper-right corner, and the data is presented in a pivot table.
The various employees, organized by department, populate the rows. The columns display the following totals: the monthly Wage, the Fuel Card budget, total Annual Employee Budget (also referred to as the annual salary), the number of New Employees, as well as the number of Departure Employees (employees who left).
Employee retention rate comparison report
It is possible to compare data only for employees who left, compared to the total current employees, between two separate time periods. This is commonly referred to as the employee retention rate.
To view these metrics, first open the Employee Analysis report by navigating to . Click the (Pivot) icon in the upper-right corner to view the information in a pivot table.
Next, click the Measures button in the upper-left corner, revealing a drop-down menu. Click # New Employees, Annual Employee Budget, Fuel Card, and Wage in the list, to deselect these metrics and hide them in the table. Then, click Count at the bottom of the list to enable that metric.
Click away from the drop-down menu to close it. Now, the report shows all the employees who left the company (# Departure Employee), as well as the total number of employees (Count), for the Last 365 Days.
Để so sánh dữ liệu năm hiện tại với năm trước, nhấp vào biểu tượng (mũi tên xuống) trong thanh tìm kiếm để hiển thị các tùy chọn lọc và nhóm. Nhấp 365 ngày trước trong cột Bộ lọc để tắt bộ lọc này. Sau đó, nhấp Ngày và chọn năm hiện tại (trong ví dụ này là 2024) từ menu thả xuống hiện ra.
Once a selection is made beneath Date in the Filters column, a Comparison column appears. Click Date: Previous Year in the new column, then click off of the drop-down menu to close it.
Ghi chú
In Odoo, in order to access the Comparison column, a specific time other than Last 365 Days must be selected. If not, the Comparison column is not visible.
Now, the pivot table displays the total number of employees who left the company (# Departure Employee), as well as the total number of employees (Count) in the columns. These are further divided by the two different years, and also displays the Variation between the two.
The rows display the departments, and lists each individual employee for each department, in the rows.
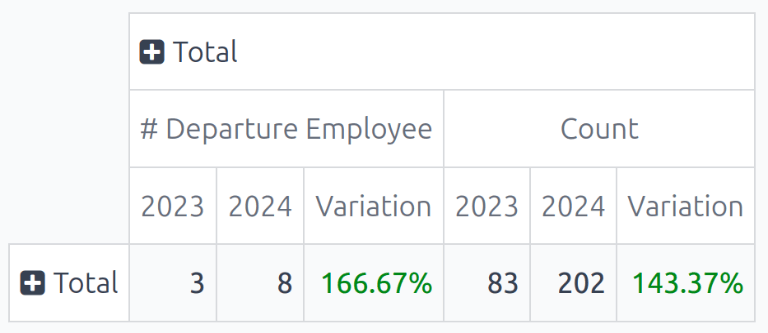
Để có cái nhìn tổng quan hơn về báo cáo này, hãy nhấp vào Tổng phía trên hàng đầu của phòng ban và nhân viên để thu gọn các hàng. Bây giờ, bảng sẽ hiển thị tổng số nhân viên đã rời công ty trong cả hai năm, so với tổng số nhân viên của cả hai năm, bao gồm cả sự chênh lệch được thể hiện dưới dạng phần trăm.
Example
Trong ví dụ này, 3 nhân viên trong tổng số 83 đã nghỉ việc vào năm 2023, và 8 nhân viên trong tổng số 202 đã nghỉ việc vào năm 2024. Có sự gia tăng 166.67% số nhân viên nghỉ việc trong năm 2024 so với năm 2023. Ngoài ra, tổng số nhân viên năm 2024 đã tăng 143.37% so với năm 2023.
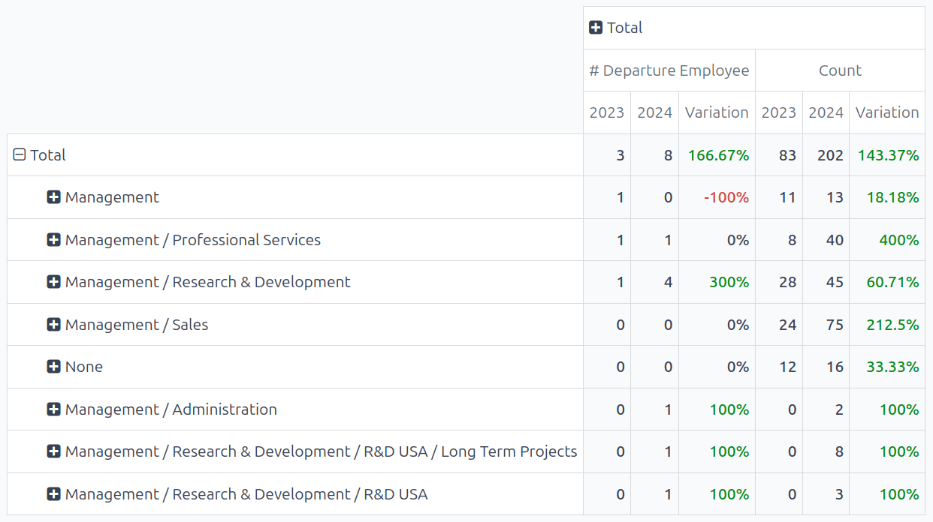
Để xem tỷ lệ chi tiết hơn theo từng phòng ban, nhấp Tổng ở hàng đơn để hiển thị menu thả xuống và chọn Phòng ban. Nhấp ra ngoài menu thả xuống để đóng lại, bây giờ bảng pivot sẽ hiển thị tổng số nhân viên đã nghỉ việc (# Nhân viên nghỉ), tổng số nhân viên (Số lượng) và Biến động (theo phần trăm) cho cả năm 2023 và 2024, được sắp xếp theo phòng ban.
Example
In this example, it can be determined that the Management department had the best retention rate in 2024 as compared to 2023, with a Variation rate of -100%. Additionally, it can be determined that the Management / Research & Development department had the most turnover, with a Variation of 300%.