
Laporan PDF
With Studio, you can edit existing PDF reports (e.g., invoices, quotations, etc.) or create new ones.
Layout default
The default layout of reports is managed outside Studio. Go to , then, in the Companies section, click Configure Document Layout. Layout settings are company-specific but apply to all reports.
Tip
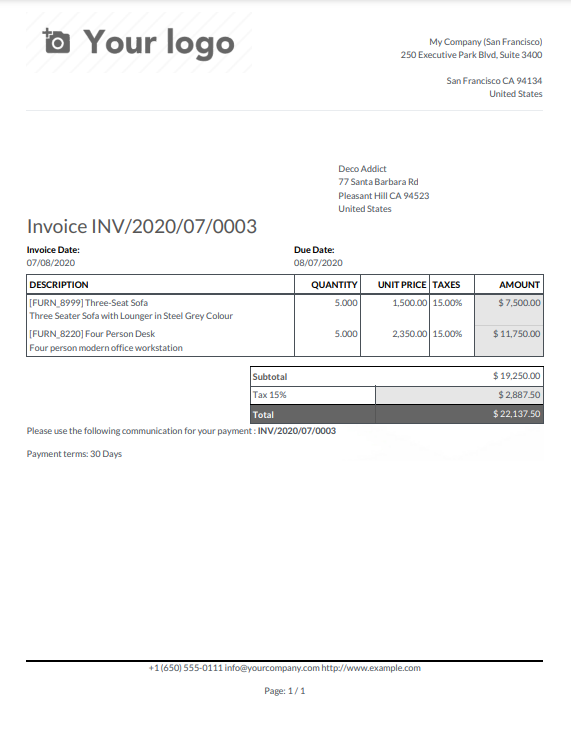
You can see how the different settings affect the report layout in the report preview on the right, or download a sample invoice PDF by clicking Download PDF Preview.
Gunakan pengaturan berikut:
Layout: Four layouts are available:



Font: Seven fonts are available: Lato, Roboto, Open Sans, Montserrat, Oswald, Raleway, and Tajawal (which supports Arabic and Latin scripts). Go to the Google Fonts website to preview them.
Company logo: Klik tombol Edit untuk mengunggah atau mengubah logo. Ini menambahkan logo ke catatan perusahaan pada model Company, yang dapat Anda akses dengan membuka lalu mengklik Update Info di bagian Companies.
Colors: Ubah warna primer dan sekunder yang digunakan untuk menyusun laporan. Warna default secara otomatis dihasilkan berdasarkan warna logo.
Layout background: The following backgrounds are available:
Blank: nothing is displayed.
Geometric: an image featuring geometric shapes is displayed in the background.
Custom: upload a custom background image.
Company tagline: This is displayed in the header of external reports. You can add multiple lines of text.
Company details: These are displayed in the header of external reports. You can add multiple lines of text.
Paper format: to define the default paper size of reports. You can select A4 (21 cm x 29.7 cm), US Letter (21.59 cm x 27.54 cm), or QR codes page. This can also be defined for individual reports in the Paper format field in Studio.
Membuat laporan PDF baru
To create a new report for a model, access the model, click the Toggle Studio button, then click Reports. Click New and, in the popup window that opens, select the type of report. This is solely used to determine what is displayed in the header and footer:
Setelah Anda membuat laporan, Anda dapat mulai mengeditnya.
Mengedit laporan PDF
To access the reports available for a model, access the model (e.g., sales orders), click the Toggle Studio button, then click Reports. Select an existing report to open it or create a new one.
Tip
Sebagai alternatif, Anda juga dapat membuka Studio, klik Reports, dan cari laporan atau model tertentu.
Penting
It is strongly recommended to duplicate the standard report and perform changes in the duplicated version. To duplicate a report, hover the mouse pointer on the top right corner of the report, click the vertical ellipsis icon (⋮), and then select Duplicate.

Opsi
Once you've selected or created a report, you can use the options in the left part of the screen to:
Change the Report name. The new name is applied everywhere (in Studio, under the Print button, and in the PDF file name).
Modify the Paper format. If no value is selected, the format defined in the default layout is used.
Show in print menu: to add the report in the Print menu available from the record.
Muat ulang dari lampiran: untuk menyimpan laporan sebagai lampiran pada record saat pertama kali dibuat dan memuat ulang versi asli laporan pada waktu berikutnya. Ini diperlukan secara hukum untuk faktur dan terutama digunakan dalam kasus ini.
Batasi visibilitas untuk grup: untuk membatasi ketersediaan laporan PDF pada grup pengguna tertentu.
Edit sumber: untuk memodifikasi laporan secara langsung di file XML.
Reset laporan: untuk membuang semua perubahan yang dibuat pada laporan dan mengatur ulang ke versi standarnya.
Pratinjau cetak: untuk membuat dan mengunduh pratinjau laporan.
Editor laporan
The report editor allows you to modify the formatting and contents of the report.
Tip
You can Undo or Redo changes using the related buttons or the shortcuts
CTRL ZandCTRL Y.Perubahan disimpan secara otomatis saat Anda meninggalkan laporan atau secara manual menggunakan tombol Simpan.
Anda dapat mengatur ulang laporan ke versi standarnya dengan mengklik tombol Reset laporan di bagian kiri layar.
Penting
Mengedit header dan footer laporan berdampak pada semua laporan standar dan kustom.
Blok kondisional
Persegi panjang putus-putus mewakili blok kondisional (pernyataan if/else). Ini digunakan untuk menampilkan/menyembunyikan konten berdasarkan kondisi tertentu. Klik blok untuk melihat kondisinya.

Pilih nilai untuk melihat pratinjau output yang sesuai dan edit jika perlu.

Catatan
Conditions can only be edited in XML.
Konten lain
Ada dua jenis konten teks dalam laporan:
Static text, i.e., the text that's not highlighted in blue, which can be modified directly in the editor.
Dynamic text, i.e., the text that's highlighted in blue, which is replaced by field values when the report is generated, e.g., the SO number or the quotation date.
You can add content (e.g., fields, lists, tables, images, banners, etc.) to the report using
commands. Type / to open the powerbox, then type the command's
name or select it from the list.
Untuk menambahkan teks statis ke laporan, ketik teks di tempat yang Anda inginkan.
Untuk perubahan yang lebih lanjut, Anda dapat mengedit laporan dalam XML secara langsung.
Tambahkan field
To add a field, type / and select the Field command. In the list that opens, select
or search for the field; click the right arrow next to the field name to access the list of related
fields if needed. Then, specify the default value and press Enter.

Add a data table
Data tables are used to display relational fields. To add
a data table, type /, select the Dynamic Table command, and select the relation to be
displayed in the table.
Catatan
Only relations of type one2many or many2many can be displayed as data tables.
Once the table has been added, you can add columns using the table tools. Position the cursor on top of the column, then click the purple rectangle and select an option.
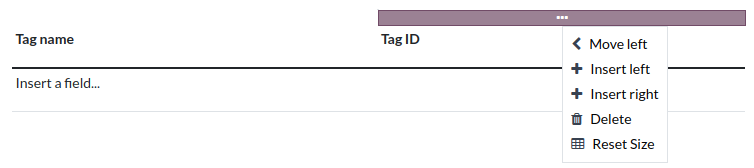
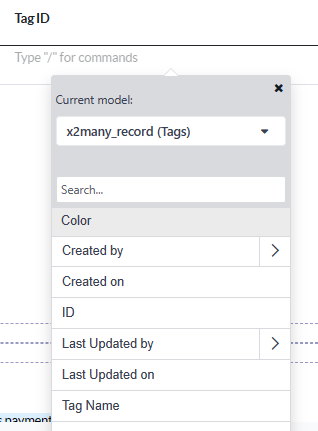
You can then insert the field of your choice in the columns. The dialog box that opens shows the source object for the field (e.g., the Tag model) and the list of available fields.
Catatan
The default row automatically iterates over the field's content, generating a row on the report for each field value (e.g., one row per tag). You can add static content rows above or below the generated rows using the table tools.
You can also add data tables by modifying the report's XML.
Formatting
To format text in the report, select it, then format it using the options in the Text editor.

Mengedit XML laporan
Peringatan
Memodifikasi XML secara langsung dapat mengakibatkan masalah laporan selama upgrade. Jika ini terjadi, cukup salin perubahan Anda dari database lama ke database yang telah diupgrade.
Untuk mengedit XML laporan, klik Edit sources di panel kiri.
Contoh
Sometimes, tables are not properly recognized as such due to complex structures. In those cases, you can still modify them manually in the report XML. For example, with a sales order, you can find the following structure in the XML (simplified for documentation purposes):
<!-- table root element -->
<table>
    <!-- thead = table header, the row with column titles -->
    <thead>
        <!-- table row element -->
        <tr>
            <!-- table header element -->
            <th>Name</th>
            <th>Price</th>
        </tr>
    </thead>
    <!-- table body, the main content -->
    <tbody>
        <!-- we create a row for each subrecord with t-foreach -->
        <tr t-foreach="record.some_relation_ids" t-as="line">
            <!-- for each line, we output the name and price as table cells -->
            <td t-out="line.name"/>
            <td t-out="line.price"/>
        </tr>
    </tbody>
</table>
To modify a table, you must ensure that each row has the same number of data cells. For example, in the case above, you need to add a cell in the header section (with e.g., the column title) and another one in the body section with the field content (usually, with a
t-outort-fielddirective).<table> <!-- table root element --> <thead> <!-- thead = table header, the row with column titles --> <tr> <!-- table row element --> <th>Name</th> <!-- table header element --> <th>Price</th> <th>Category</th> </tr> </thead> <tbody> <!-- table body, the main content --> <tr t-foreach="record.some_relation_ids" t-as="line"> <!-- we create a row for each subrecord with t-foreach --> <td t-out="line.name"/> <!-- for each line, we output the name and price as table cells --> <td t-out="line.price"/> <td t-out="line.category_id.display_name"/> </tr> </tbody> </table>Catatan
Cells can span multiple rows or columns. For more information, go to the Mozilla Developer Network website.
For example, you can modify the Quotation/Order report to add a column to display the product category in the main table:
<table class="table table-sm o_main_table table-borderless mt-4">
    <!-- In case we want to repeat the header, remove "display: table-row-group" -->
    <thead style="display: table-row-group">
        <tr>
            <th name="th_description" class="text-start">Description</th>
            <th>Product Category</th>
            <th name="th_quantity" class="text-end">Quantity</th>
            <th name="th_priceunit" class="text-end">Unit Price</th>
[...]
            <tr t-att-class="'bg-200 fw-bold o_line_section' if line.display_type == 'line_section' else 'fst-italic o_line_note' if line.display_type == 'line_note' else ''">
                <t t-if="not line.display_type">
                    <td name="td_name"><span t-field="line.name">Bacon Burger</span></td>
                    <td t-out="line.product_id.categ_id.display_name"/>
                    <td name="td_quantity" class="text-end">
                        <span t-field="line.product_uom_qty">3</span>
                        <span t-field="line.product_uom">units</span>
                        <span t-if="line.product_packaging_id">
To add a table in XML, you need to know the names of the fields and objects you wish to access and display. As an example, let's add a table that details the tags on a sales order:
<!-- table root element -->
<table class="table">
    <!-- thead = table header, the row with column titles -->
    <thead>
        <!-- table row element -->
        <tr>
            <!-- table header element -->
            <th>ID</th>
            <th>Name</th>
        </tr>
    </thead>
    <!-- table body, the main content -->
    <tbody>
        <!-- we create a row for each subrecord with t-foreach -->
        <tr t-foreach="doc.tag_ids" t-as="tag">
            <!-- for each line, we output the name and price as table cells -->
            <td t-out="tag.id"/>
            <td t-out="tag.name"/>
        </tr>
    </tbody>
</table>

Catatan
When adding tables manually, style them using Bootstrap classes, like the table class included in the
example above.
Jika Anda ingin menampilkan/menyembunyikan konten berdasarkan kondisi tertentu, Anda dapat menambahkan pernyataan kontrol if/else secara manual dalam XML laporan.
Misalnya, jika Anda ingin menyembunyikan tabel data kustom jika tidak ada tag, Anda dapat menggunakan atribut t-if untuk mendefinisikan kondisi, yang kemudian dievaluasi sebagai True atau False. Tabel tidak akan ditampilkan jika tidak ada tag dalam penawaran.
<!-- table root element -->
<table class="table" t-if="len(doc.tag_ids) > 0">
    <!-- thead = table header, the row with column titles -->
    <thead>
        <!-- table row element -->
        <tr>
            <!-- table header element -->
            <th>ID</th>
            <th>Name</th>
        </tr>
    </thead>
    <!-- table body, the main content -->
    <tbody>
        <!-- we create a row for each subrecord with t-foreach -->
        <tr t-foreach="doc.tag_ids" t-as="tag">
            <!-- for each line, we output the name and price as table cells -->
            <td t-out="tag.id"/>
            <td t-out="tag.name"/>
        </tr>
    </tbody>
</table>
Jika Anda ingin menampilkan blok lain dalam hal pernyataan t-if dievaluasi sebagai False, Anda dapat menentukannya menggunakan pernyataan t-else. Blok t-else harus langsung mengikuti blok t-if dalam struktur dokumen. Tidak perlu menentukan kondisi apa pun dalam atribut t-else. Sebagai contoh, mari tampilkan pesan singkat yang menjelaskan bahwa tidak ada tag pada penawaran:
<!-- table root element -->
<table class="table" t-if="len(doc.tag_ids) > 0">
    <!-- thead = table header, the row with column titles -->
    <thead>
        <!-- table row element -->
        <tr>
            <!-- table header element -->
            <th>ID</th>
            <th>Name</th>
        </tr>
    </thead>
    <!-- table body, the main content -->
    <tbody>
        <!-- we create a row for each subrecord with t-foreach -->
        <tr t-foreach="doc.tag_ids" t-as="tag">
            <!-- for each line, we output the name and price as table cells -->
            <td t-out="tag.id"/>
            <td t-out="tag.name"/>
        </tr>
    </tbody>
</table>
<div class="text-muted" t-else="">No tag present on this document.</div>
Dengan menggunakan notasi t-if/t-else, editor laporan mengenali bahwa bagian-bagian ini saling eksklusif dan harus ditampilkan sebagai blok kondisional:

Anda dapat mengalihkan kondisi menggunakan editor untuk mempratinjau outputnya:

Jika Anda ingin memiliki beberapa opsi, Anda juga dapat menggunakan direktif t-elif untuk menambahkan kondisi perantara. Misalnya, begini cara judul laporan sales order berubah berdasarkan kondisi dokumen yang mendasarinya.
<h2 class="mt-4">
    <span t-if="env.context.get('proforma', False) or is_pro_forma">Pro-Forma Invoice # </span>
    <span t-elif="doc.state in ['draft','sent']">Quotation # </span>
    <span t-else="">Order # </span>
    <span t-field="doc.name">SO0000</span>
</h2>
Judul Pro-Forma Invoice digunakan bergantung pada beberapa kondisi kontekstual. Jika kondisi ini tidak terpenuhi dan status dokumen adalah draft atau sent, maka Quotation digunakan. Jika tidak ada kondisi tersebut yang terpenuhi, judul laporan adalah Order.
Working with images in a report can be challenging, as precise control over image size and
behavior is not always obvious. You can insert image fields using the report editor
(by using the /Field command), but inserting them in XML
using the t-field directive and accompanying t-options attributes provides better sizing and
positioning control.
Misalnya, kode berikut menghasilkan field image_128 dari produk baris sebagai gambar lebar 64px (dengan tinggi otomatis berdasarkan rasio aspek gambar).
<span t-field="line.product_id.image_128" t-options-widget="image" t-options-width="64px"/>
Opsi berikut tersedia untuk widget gambar:
width: lebar gambar, biasanya dalam piksel atau unit panjang CSS (misalnya,rem) (biarkan kosong untuk lebar otomatis).height: tinggi gambar, biasanya dalam piksel atau unit panjang CSS (misalnya,rem) (biarkan kosong untuk tinggi otomatis).class: kelas CSS yang diterapkan pada tagimg; kelas Bootstrap tersedia.alt: teks alternatif gambarstyle: atribut style; memungkinkan Anda mengganti style lebih bebas daripada dengan kelas Bootstrap.
Atribut ini harus berisi string, yaitu teks yang diapit tanda kutip di dalam tanda kutip, misalnya, t-options-width="'64px'" (atau, alternatifnya, ekspresi Python yang valid).
Catatan
Widget gambar tidak dapat digunakan pada tag img. Sebaliknya, atur direktif t-field pada node span (untuk konten inline) atau div (untuk konten blok).
Misalnya, mari tambahkan kolom dengan gambar produk di tabel quotation:
<table class="table table-sm o_main_table table-borderless mt-4">
    <thead style="display: table-row-group">
        <tr>
            <th>Image</th>
            <th name="th_description" class="text-start">Description</th>
            <th>Product Category</th>
            <th name="th_quantity" class="text-end">Quantity</th>
            <th name="th_priceunit" class="text-end">Unit Price</th>
[...]
        <t t-foreach="lines_to_report" t-as="line">
            <t t-set="current_subtotal" t-value="current_subtotal + line.price_subtotal"/>
            <tr t-att-class="'bg-200 fw-bold o_line_section' if line.display_type == 'line_section' else 'fst-italic o_line_note' if line.display_type == 'line_note' else ''">
                <t t-if="not line.display_type">
                   <td>
                       <span t-field="line.product_template_id.image_128"
                             t-options-widget="'image'"
                             t-options-width="'64px'"
                             t-options-class="'rounded-3 shadow img-thumbnail'"
                           />
                   </td>
                    <td name="td_name"><span t-field="line.name">Bacon Burger</span></td>
                    <td t-out="line.product_id.categ_id.display_name"/>
Atribut t-options-width membatasi lebar gambar menjadi 64 piksel, dan kelas Bootstrap yang digunakan dalam t-options-class membuat border seperti thumbnail dengan sudut membulat dan bayangan.
