Vendor costs report
With the Purchase application, users can track the fluctuation of vendor costs over time. This allows users to identify the most expensive vendors, and track seasonal changes.
Create vendor costs reports
To create a vendor costs report, first navigate to to open the Purchase Analysis dashboard. By default, the dashboard displays a line chart overview of the Untaxed Total of POs (Purchase Orders) with a Confirmation Date for the current month, or of RFQs (Requests for Quotation) with a status of Draft, Sent, or *Cancelled.
Add filters and groups
On the top-right, click the (pivot) icon to switch to pivot view.
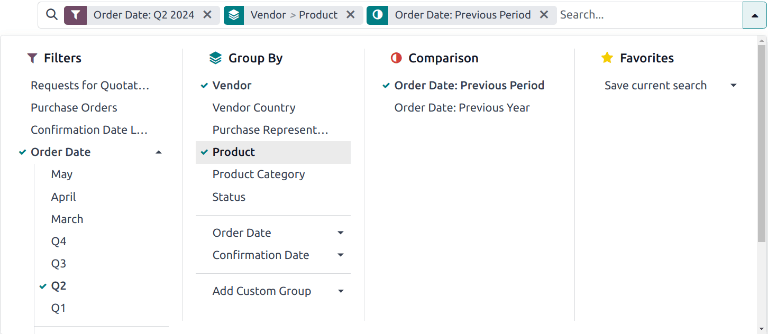
Remove any default filters from the Search… bar. Then, click the (down) icon to open the drop-down menu that contains the Filters, Group By, and Favorites columns.
Nota
Unless otherwise specified, the report displays data from both RfQs and POs. This can be changed by selecting either Requests for Quotation or Purchase Orders under the Filters column.
Under the Filters column, select a date range to use for comparison. The report can be filtered by either Order Date or Confirmation Date. Choose one from the list, and click the (down) icon to specify the date range, either by month, quarter, or year.
Next, under the Group by column, select Vendor. Then, select Product, which is also located in the Group By column.
Nota
Selecting Product is not required for this report. However, it is recommended, as it provides additional insight into the performance of individual vendors. Additional selections can be made under the Group by heading as well, including Product Category, Status, and Purchase Representative.
To ensure the report is generated correctly, make sure that Vendor is the first selection made under the Group By column.
Next, make a selection under the Comparison heading. These options are only available after the date range is selected under the Filters column, and vary based on that range. Previous Period adds a comparison to the previous period, such as the last month or quarter. Previous Year compares the same time period from the previous year.
Nota
While multiple time-based filters can be added at once, only one comparison can be selected at a time.
Add measures
After selecting the Filters, Group by, and Comparison settings, click out of the drop-down menu.
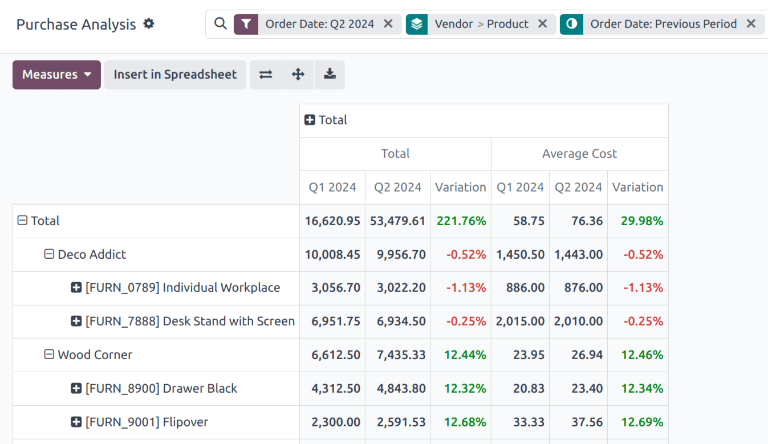
By default, the report displays with the following measures: Order, Total, Untaxed Total, and Count. Click Measures at the top-left to open the drop-down list of available measures. Click Average Cost to add it to the report. Select any additional measures to add to the report, or click on any of the already selected measures to remove them, if desired.
Suggerimento
It is recommended to run the report with at least Average Cost, Total, or Untaxed Total selected from the Measures list. Additional measures, such as Days to Receive, can be added to provide additional insights.
View results
After all of the filters and measures have been selected, the report generates in the pivot view. Click Insert in Spreadsheet to add the pivot view into an editable spreadsheet format within the Documents app.
Importante
The Insert in Spreadsheet option is only available if the Documents Spreadsheet module is installed.
Nota
The vendor costs report is also available in graph view. Click the (area chart) icon to change to graph view. Click the corresponding icon at the top of the report to switch to a (bar chart), (line chart), or (pie chart).
Vedi anche
To save this report as a favorite, see Preferite.