报告
Odoo Live Chat includes several reports that allow for the monitoring of operator performance and the identification of trends in customer conversations.
可用报告
The following reports are included in the Live Chat app:
注解
The Live Chat Ratings Report can also be accessed through the Report menu. For more information on this report, and on the Live Chat rating process, see Live Chat Ratings.
要访问所有可用报告的下拉菜单,请前往 。
会话历史
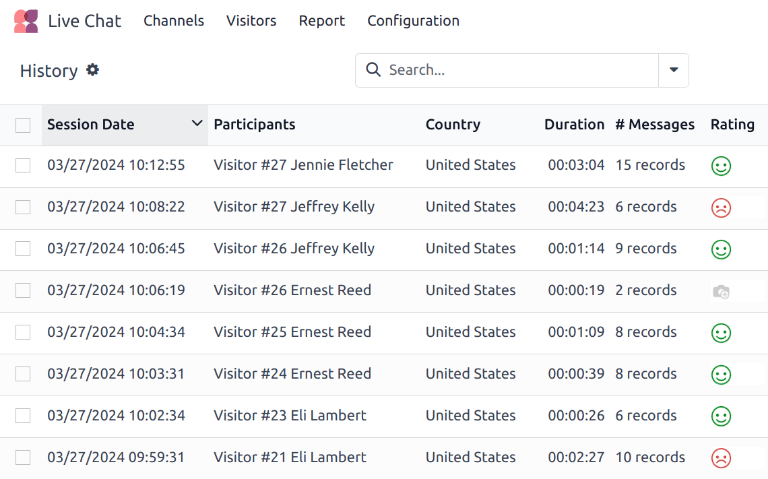
*会话历史*报告显示了在线客服会话的概览,包括会话日期、参与者姓名和国家/地区、会话时长、消息数量和评分。它还提供了对在线客服会话完整记录的访问权限。
To access this report, navigate to .

此报告中的信息可以导出或插入到电子表格中。
点击左上角 ⚙️(齿轮)`页面标题右侧的 :guilabel:`历史 图标。这样就会显示一个下拉菜单。
从下拉菜单中单击 全部导出 将所有会话导出到电子表格,或点击 在电子表格中插入列表 将信息插入新的或现有的电子表格。
要只导出选定的会话,请首先点击每个会话左侧的复选框,从列表中选择要导出的会话。选定会话后,单击页面顶部中央的 ⚙️(齿轮)操作 图标,然后单击 导出 或 在电子表格中插入列表。
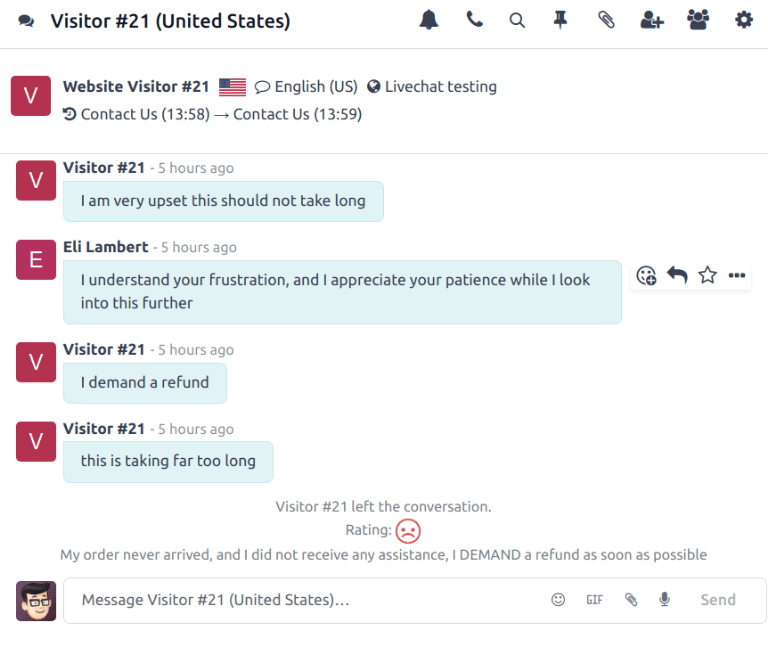
要查看单个对话的记录,请点击条目行上的任意位置。这将打开该对话的 讨论 主题。
在 讨论 线程中,对话视图会显示整个对话的副本。在对话顶部,会列出游客在开始聊天会话前浏览过的网页以及相应的时间戳。如果游客留下了评价,则会包含在副本的末尾。

对话统计
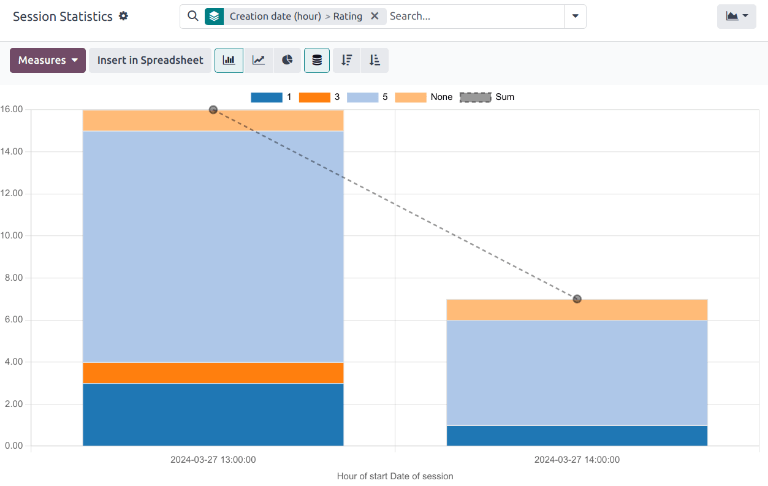
会话统计 报告提供实时聊天会话的统计概览。该报告的默认视图显示按创建日期分组的会话。
要访问此报告,请导航至 。

会话统计 报告的堆叠条形图视图,结果按创建日期(小时)分组,然后按评级分组。
要查看不同的衡量标准,请点击报告左上角的 衡量标准 下拉菜单。本报告可用的衡量标准包括:
参与者数量:对话中的参与人数。
活跃天数:自操作员首次会话以来的天数。
会话时长(分钟):对话的持续时间,以分钟为单位。
访客是否匿名:表示对话参与者是否为匿名状态。
每条会话消息数:在一次对话中发送的消息总数。此指标包含在默认视图中。
评分:操作员在会话结束时收到的评分(如有提供)。
会话未评分:表示会话在结束时**未**收到评分。
应答时间(秒):操作员响应聊天请求前的平均时间(以秒为单位)。
访客满意度:表示是否提供了正面评分。如果访客给出了负面或中性评分,则视为不满意。
总数:会话的总数量。
操作者分析
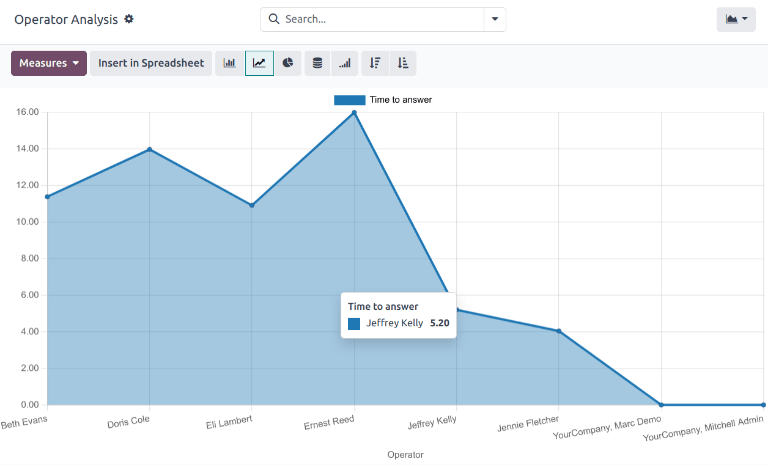
*操作员分析*报告用于监控各个在线客服操作员的绩效表现。
要访问此报告,请前往 。
此报告的默认视图为条形图,且仅显示当前月份的对话数据,这由默认搜索筛选条件 本月 所决定。对话按操作员进行分组。
要查看不同的衡量标准,请点击报告左上角的 衡量标准 下拉菜单。本报告可用的衡量标准包括:
会话数量:操作员参与的会话次数。此指标默认包含在内。
:guilabel:`平均时长`对话的平均持续时间,单位为秒。
平均评分:操作员收到的平均评分。
平均应答时间:操作员响应聊天请求前的平均时间,单位为秒。
总数:会话的总数量。

查看和筛选选项
On any Odoo report, the view and filter options vary, depending on what data is being analyzed, measured, and grouped. See below for additional information on the available views for the Live Chat reports.
注解
The Sessions History report is only available in list view.
数据透视视图
The pivot view presents data in an interactive manner. The Session Statistics and Operator Analysis reports are available in pivot view.
The pivot view can be accessed on a report by selecting the grid icon at the top-right of the screen.
要在行或列中添加组,请点击 ➖(加号) 旁边的 总计 图标,然后从出现的下拉菜单中选择一个组。要删除一个组,请点击:guilabel:➖(减号) 图标,然后取消选择相应的选项。
图形视图
图表 视图以 条形图、线形图 或 饼状图 显示数据。图形视图中提供 会话统计 和 操作员分析 报告。
选择屏幕右上方的 折线图 图标,切换到图表视图。要在不同图表之间切换,请在图形视图中选择图表左上方所需的视图对应图标。
小技巧
条形图和折线图都可以使用 堆叠 视图选项。这样可以将两组(或多组)数据叠加显示,而不是并排显示,从而更容易比较数据。