Reports
Odoo Live Chat includes several reports that allow for the monitoring of operator performance and the identification of trends in customer conversations.
Available reports
The following reports are included in the Live Chat app:
Note
The Live Chat Ratings Report can also be accessed through the Report menu. For more information on this report, and on the Live Chat rating process, see Live Chat Ratings.
To access a drop-down menu of all the available reports, navigate to .
Sessions History
The Sessions History report displays an overview of live chat sessions, including session dates, participant name and country, session duration, the number of messages, and the rating. It also provides access to the complete transcripts of live chat sessions.
To access this report, navigate to .
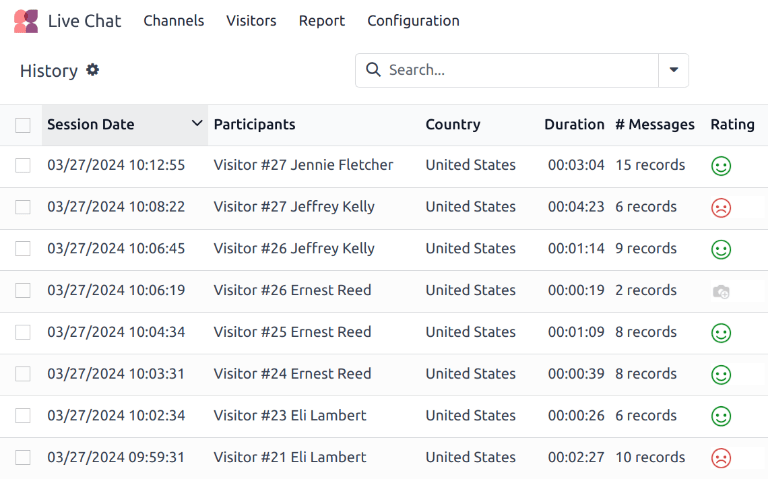
The information in this report can be exported, or inserted into a spreadsheet.
Click the ⚙️ (gear) icon to the right of the History page title, in the top-left corner. Doing so reveals a drop-down menu.
From the drop-down menu, click Export All to export all sessions to a spreadsheet, or Insert list in spreadsheet to insert the information in a new, or existing, spreadsheet.
To only export select sessions, first select the desired sessions to be exported from the list, by clicking the checkbox to the left of each individual session. With the sessions selected, click the ⚙️ (gear) Actions icon in the top-center of the page, and click Export or Insert list in spreadsheet.
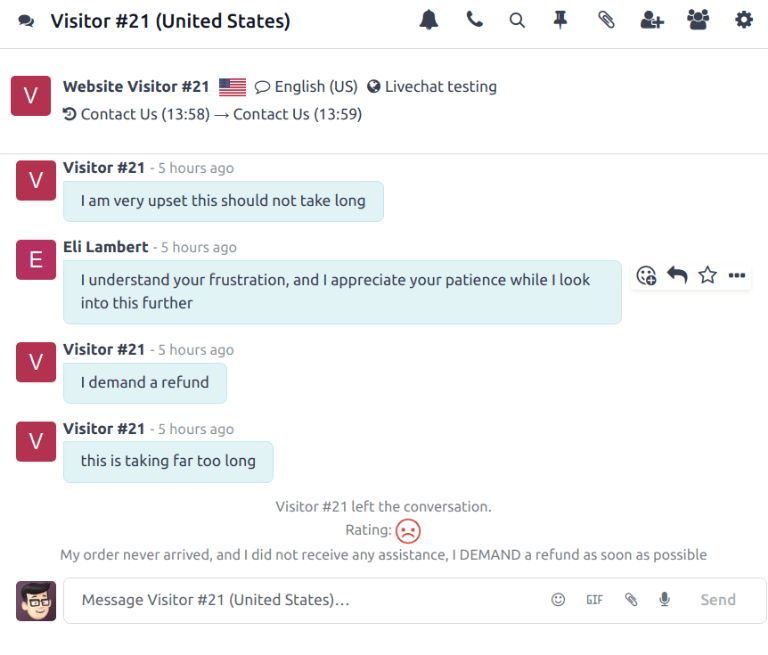
To view the transcript of an individual conversation, click anywhere on the entry line. This opens the Discuss thread for the conversation.
In the Discuss thread, the conversation view displays the entire transcript of the conversation. At the top of the conversation, there is a list of the web pages the visitor browsed before beginning their chat session, along with corresponding time stamps. If the visitor left a rating, it is included at the end of the transcript.
Session Statistics
The Session Statistics report provides a statistical overview of live chat sessions. The default view for this report displays sessions grouped by the date of creation.
To access this report, navigate to .
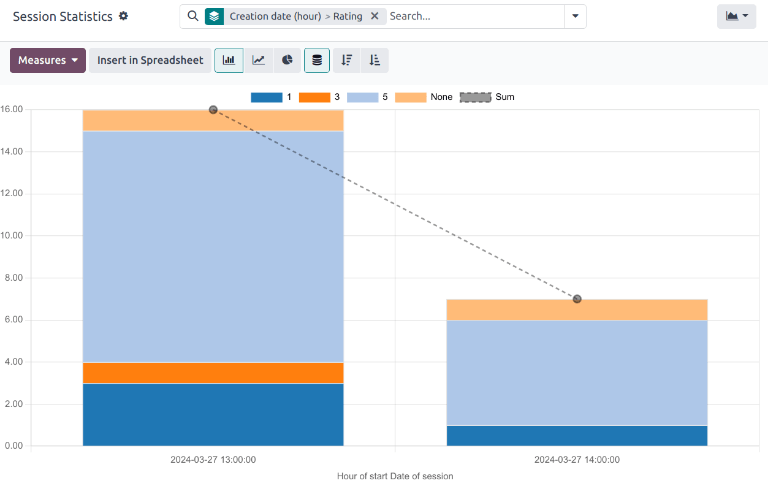
The stacked bar graph view of the Session Statistics report, with results grouped by Creation Date (hour), then by rating.
To view a different measure, click the Measures drop-down menu at the top-left of the report. The measures available for this report include:
# of speakers: number of participants in the conversation.
Days of activity: number of days since the operator’s first session.
Duration of Session (min): the duration of a conversation, in minutes.
Is visitor anonymous: denotes whether the conversation participant is anonymous.
Messages per session: the total number of messages sent in a conversation. This measure is included in the default view.
Rating: the rating received by an operator at the end of a session, if one was provided.
Session not rated: denotes if a session did not receive a rating at the end of the conversation.
Time to answer (sec): the average time, in seconds, before an operator responds to a chat request.
Visitor is Happy: denotes whether a positive rating was provided. If the visitor gave either a negative or neutral rating, they are considered unhappy.
Count: the total number of sessions.
Operator Analysis
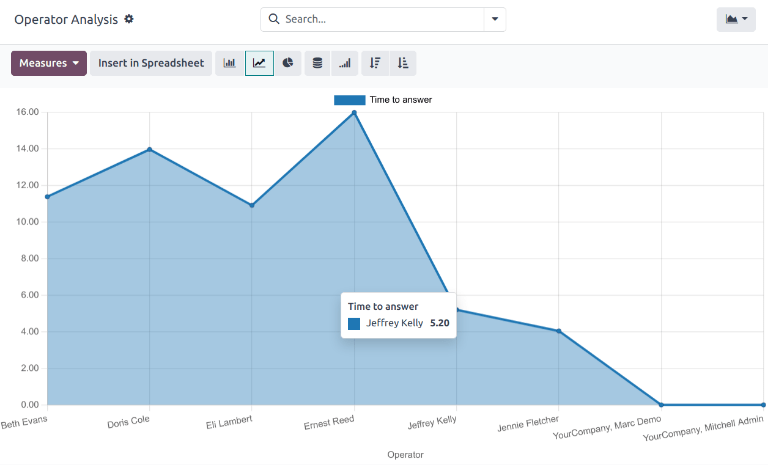
The Operator Analysis report is used to monitor the performance of individual live chat operators.
To access the report, navigate to .
The default view for this report is a bar chart, which only displays conversations from the current month, as indicated by the This Month default search filter. Conversations are grouped by operator.
To view a different measure, click the Measures drop-down menu at the top-left of the report. The measures available for this report include:
# of Sessions: the number of sessions an operator participated in. This measure is included by default.
Average duration: the average duration of a conversation, in seconds.
Average rating: the average rating received by the operator.
Time to answer: the average amount of time before the operator responds to a chat request, in seconds.
Count: the total number of sessions.
View and filter options
On any Odoo report, the view and filter options vary, depending on what data is being analyzed, measured, and grouped. See below for additional information on the available views for the Live Chat reports.
Note
The Sessions History report is only available in list view.
Pivot view
The pivot view presents data in an interactive manner. The Session Statistics and Operator Analysis reports are available in pivot view.
The pivot view can be accessed on a report by selecting the grid icon at the top-right of the screen.
To add a group to a row or column, click the ➕ (plus sign) icon next to Total, and then select one of the groups from the drop-down menu that appears. To remove one, click the ➖ (minus sign) icon, and de-select the appropriate option.
Graph view
The graph view presents data in either a bar, line, or pie chart. The Session Statistics and Operator Analysis reports are available in graph view.
Switch to the graph view by selecting the line chart icon at the top-right of the screen. To switch between the different charts, select the desired view’s corresponding icon at the top-left of the chart, while in graph view.
Tip
Both the bar chart and line chart can utilize the stacked view option. This presents two or more groups of data on top of each other, instead of next to each other, making it easier to compare data.