Analyze the performance of my vendors
Als uw bedrijf regelmatig producten koopt van verschillende leveranciers is het handig om statistieken te krijgen van uw inkopen. Er zijn verschillende redenen om leveranciers hun prestaties te traceren en analyseren:
You can see how dependent from a supplier your company is;
U kan onderhandelen over kortingen op prijzen;
U kan de gemiddelde levertijd per leverancier controleren;
Etc.
For example, an IT products reseller that issues dozens of purchase orders to several suppliers each week may want to measure for each product the total price paid for each vendor and the delivery delay. The insights gathered by the company will help it to better analyze, forecast and plan their future orders.
Configuratie
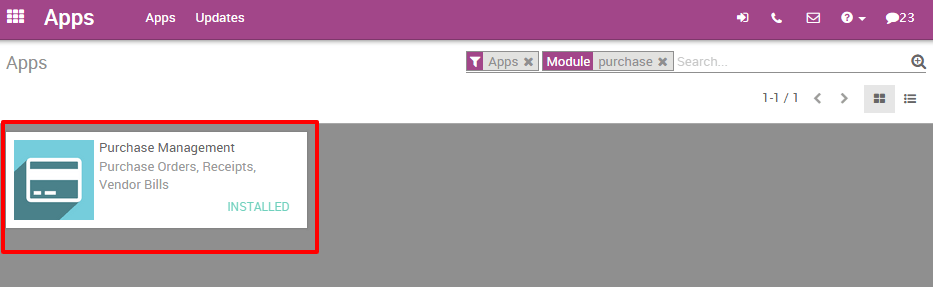
Installeer de Inkoopbeheer module
Vanuit het Apps menu zoekt u de module Inkoopbeheer en installeert u deze.
Plaats enkele bestellingen
Of course, in order to analyze your vendors’ performance, you need to issue some Request For Quotations (RfQ) and confirm some Purchase Orders.
Analyseer uw leveranciers
Genereer flexibele rapporten
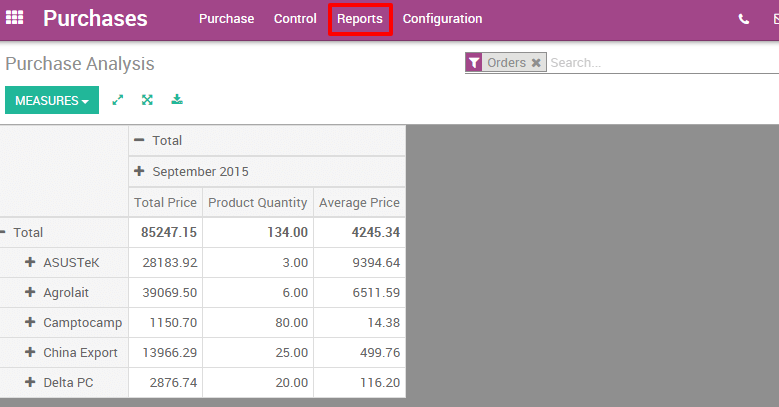
You have access to your vendors’ performances on the Reports menu. By default, the report groups all your purchase orders on a pivot table by total price, product quantity and average price for the each month and for each supplier. Simply by accessing this basic report, you can get a quick overview of your actual performance. You can add a lot of extra data to your report by clicking on the Measures icon.
Tip
By clicking on the + and - icons, you can drill up and down your report in order to change the way your information is displayed. For example, if I want to see all the products bought for the current month, I need to click on the + icon on the vertical axis and then on “Products”.
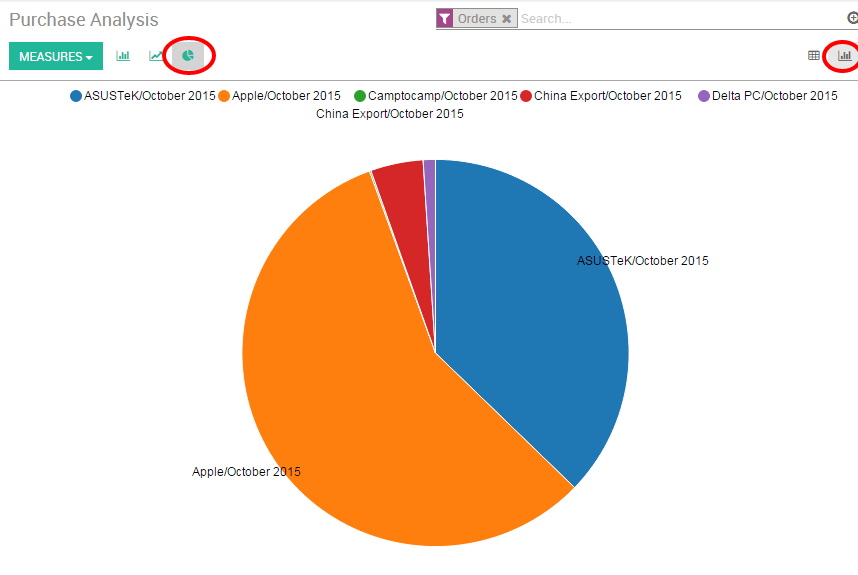
Depending on the data you want to highlight, you may need to display your reports in a more visual view. You can transform your report in just a click in 3 graph views : a Pie Chart, a Bar Chart and a Line Chart: These views are accessible through the icons highlighted on the screenshot below.
Notitie
In tegenstelling tot de draaitabel, kan een grafiek alleen worden berekend met één afhankelijke en één onafhankelijke meetwaarde.
Personaliseer rapporten
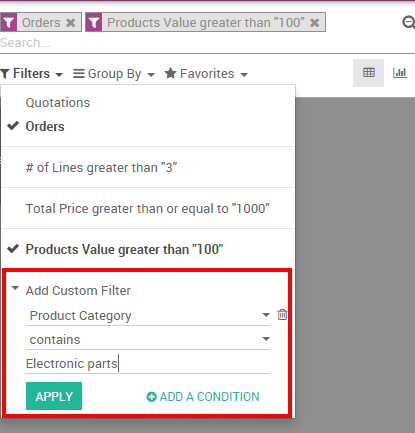
You can easily customize your purchase reports depending on your needs. To do so, use the Advanced search view located in the right hand side of your screen, by clicking on the magnifying glass icon at the end of the search bar button. This function allows you to highlight only selected data on your report. The filters option is very useful in order to display some categories of data, while the Group by option improves the readability of your reports. Note that you can filter and group by any existing field, making your customization very flexible and powerful.
Tip
U kan eender welke gepersonaliseerde filter opslaan en hergebruiken door te klikken op Favorieten vanuit het Geavanceerd zoeken scherm en vervolgens te klikken op Bewaar huidige zoekopdracht. De bewaarde filter is dan toegankelijk vanuit het Favorieten menu.