定期訂購報告
The Odoo Subscriptions app provides a series of reporting pages to help companies analyze how subscriptions are performing.
On the Subscriptions Analysis reporting page, users can view specific data related to recurring subscriptions, quantity of subscriptions, in-progress or paused subscriptions, and more.
保留分析 報告頁面:以表格整理及提供任何時間段內定期訂購項目的保留百分比。
The MRR Breakdown reporting page clearly divides MRR and ARR metrics for subscriptions into various graphs, lists, and charts.
And the MRR Analysis reporting page offers a time-based collection of analytics showcasing how subscription MRR and ARR have changed over the course of any given period of time.
報告頁面元素
All subscriptions-based reporting pages can be accessed via the Reporting header menu in the Subscriptions app.
以下各節說明每個報表頁面上的元素。
篩選器、分組依據
Filters are used to narrow down metrics to show specific analytics, whereas groupings (via the Group By option) are used to gather the data from specific sections into groups for more organized analysis.
This section refers to both filters and groupings, as a combination of the two can be saved in the Favorites section.
To modify the results being shown on any reporting page, click the (down arrow) icon to the right of the search bar. Doing so reveals a drop-down menu of detailed filter and grouping options.
If desired, a filter or grouping (or combination of filters and/or groupings) can be saved in the Favorites section of that drop-down menu. To do so, click the (down arrow) icon beside Save current search, located beneath the Favorites section.
This reveals a field to assign a title to the favorite filter. Two options are also found beneath the title field: Default filter and Shared.
Ticking the checkbox beside Default filter makes the newly-favorited filter the default option for that reporting page.
Ticking the checkbox beside Shared makes the newly-favorited filter available to other users in the database.
備註
The Default filter and Shared options are not required, and only one of these options can be selected at a time.
To save the filter, click Save in the Favorites section of the drop-down filter menu.
When clicked, that saved filter appears beneath the Favorites column of the drop-down filter menu, and a (gold star) icon appears beside the favorite filter’s name in the search bar.
檢視
在 定期訂購分析、MRR 細分 以及 MRR 分析 報告頁面的右上角,提供了三個不同的檢視畫面選項。
備註
保留分析 報告頁面則 沒有 其他可用的檢視選項。
可用的檢視畫面選項,由左至右依序為:
圖表
列表
樞紐分析

每種檢視模式都有自己的一系列相關視覺選項。這些選項是特定於個別檢視畫面的。
圖表檢視模式
選擇圖表檢視時,搜尋列與數據視覺化顯示範圍之間,會出現以下選項。這些選項只限圖表檢視模式使用,位於 量度 及 插入試算表 按鈕的右方。

首三個選項由左至右代表不同的圖表檢視畫面。其餘選項代表可用作整理及視覺化顯示該組資料的不同方式。
具體的圖表相關檢視選項,由左至右分別是:
Bar Chart: showcases the data in a bar chart format.
Line Chart: showcases the data in a line chart format.
Pie Chart: showcases the data in a pie chart format.
每個圖表檢視選項,都有自己的一系列特定視覺選項,會在所選圖表檢視選項的右方,以可用按鈕形式顯示。
When the Bar Chart graph view is selected, the following visual options are available:
Stacked: showcases the data in a stacked visual format.
Descending: showcases the data in descending order.
Ascending: showcases the data in ascending order.
選用 折線圖 圖表檢視模式時,有下列視覺選項可以使用:
Stacked: showcases the data in a stacked visual format.
Cumulative: showcases the data in accumulated, increasing format.
Descending: showcases the data in descending order.
Ascending: showcases the data in ascending order.
選用 圓形圖 檢視模式時,沒有其他視覺選項可用。
列表顯示
With the list view selected, the subscription metrics being analyzed are displayed in a simple list, which can be fully customized by using any of the available filters or groupings in the drop-down filter menu (accessible via the (down arrow) icon to the right of the search bar).
備註
選用列表檢視模式時,量度 下拉式選單及 插入試算表 按鈕,都將 不可用 。
樞紐分析檢視模式
選用樞紐分析檢視模式時,定期訂購項目的指標會以一個數據表格顯示,這張數據表是可以由你完全自訂。
The pivot data table can be customized using the options available in the Measures drop-down menu, and/or the filter grouping options available in the filter drop-down menu (accessible via the (down arrow) icon to the right of the search bar).
Three pivot-specific options are available, located to the right of the Measures drop-down menu and Insert in Spreadsheet button.

這些特定於樞紐分析表的檢視選項,由左至右分別是:
Flip axis: the
xandyaxis of the pivot data table flip.Expand all: all the available rows and columns of the pivot data table expand fully.
Download .xlsx: the pivot data table is downloaded as an
.xlsxfile.
量度
The graph and pivot reporting pages have their own metric-specific Measures drop-down menu of data-related options to choose from, located in the upper-left corner, above the visual representation of metrics.

When the Measures button is clicked, a series of selectable measures becomes available, via a drop-down menu. When any of the options are selected from the Measures drop-down menu, the chosen metrics related to that specific measure appear on the reporting page.
備註
有關每個報告頁面上可以使用的不同量度的更多資訊,請參閱本文下方的 特定報告頁面細分。
插入試算表
在 量度 下拉式選單旁邊,有一個 插入試算表 按鈕。
按下後,你可透過彈出視窗,將報告頁面上目前顯示的已配置資料,加入至新的或現有的試算表或Dashboard中。

在此彈出視窗中,選擇所需的選項,然後按一下 確認。
報告頁面
In the Odoo Subscriptions app, there are four different reporting pages available.
To access, analyze, and customize various reports related to subscriptions, navigate to drop-down menu in the header to reveal the following reporting pages:
定期訂購
保留分析
MRR 細分
MRR 時間線
按下任何一個上述選項後,會顯示一個獨立、完全可自訂的報告頁面,該頁面只會專注於目前關注的定期訂購資料範疇。
下文介紹這四個具體報告頁面的詳情。
定期訂購分析
要存取 定期訂購分析 報告頁面,請前往 。
預設情況下,定期訂購分析 報告頁面會選用 圖表 檢視模式中的 棒形圖 選項。
搜尋列也提供以下篩選器:進行中或暫停 以及 經常性。

When the Measures button on the Subscriptions Analysis page is clicked, a series of metric-related options becomes available as a drop-down menu.
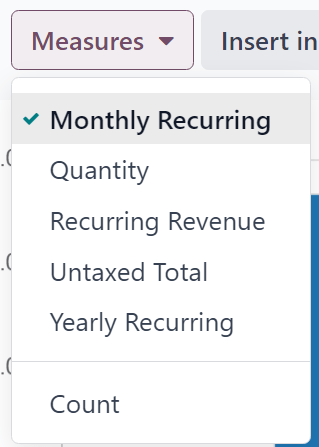
定期訂購分析 頁面的 量度 下拉式選單中,與指標相關的選項有:
每月重複
數量
經常收入
未連稅總額
每年重複
:guilabel:`數目`(個數)
備註
預設是選用 每月重複 的量度選項。
按下任何可用的量度方式時,Odoo 都會在報告頁面上顯示所選資料,以作進一步分析。
保留分析
要存取 保留分析 報告頁面,請前往 。
The Retention Analysis reporting page differs from the other Subscriptions app reporting pages, in that it does not provide any additional view options. The data on this page is only presented in a customizable data chart.

按下 保留分析 報告頁面上的 量度 下拉式選單時,系統會顯示一系列與指標相關的選項。

保留分析 報告頁面的 量度 下拉式選單中,與指標相關的選項有:
待開立發票金額
利潤
利潤率(%)
預繳百分比
裝運重量
未付金額
:guilabel:`數目`(個數)
備註
預設是會選用 數目 量度選項。
保留分析 頁面上 量度 下拉式選單的右方,是一個包含不同時間段的附加下拉式選單。預設選用的時間段是 月。
按下後,將出現一個包含各種時間段選項的下拉式選單。

可用的時間段選項有:
日
星期
月
年
選擇此下拉式選單中的時間段選項時,保留分析 報告頁面會顯示該時間段內,符合已配置的量度及篩選器的數據。
在時間段下拉式選單的右方,有一個下載按鈕,可讓使用者將 保留分析 頁面上顯示的資料,下載為 Excel 檔案。
MRR 細分
要存取 MRR 細分 報告頁面,請前往 。
By default, the data displayed on the MRR Breakdown reporting page is in graph view, with the Bar Chart option and Stacked option selected.
A default filter is also available in the search bar for Event Date: Month > Event Type.

按下 MRR 細分 報告頁面上的 量度 下拉式選單時,系統會顯示一系列與指標相關的選項。

MRR 細分 報告頁面的 量度 下拉式選單中,與指標相關的選項有:
生效訂購變化
ARR 變化
MRR 變化
:guilabel:`數目`(個數)
備註
預設會選用 MRR 變化 的量度選項。
小訣竅
To make a different measure option the default, first, select the desired measure from the Measures drop-down menu. Then, click the (down arrow) icon in the search bar to open the mega menu of filters and groupings.
In the Favorites column, click the (down arrow) icon beside Save current search to reveal a field, where a title can be entered, along with two checkboxes:Default filter and Shared.
Tick the checkbox for Default filter, and click Save.
現在,新選擇的量度選項,便會是存取此報告頁面時顯示的預設選項。
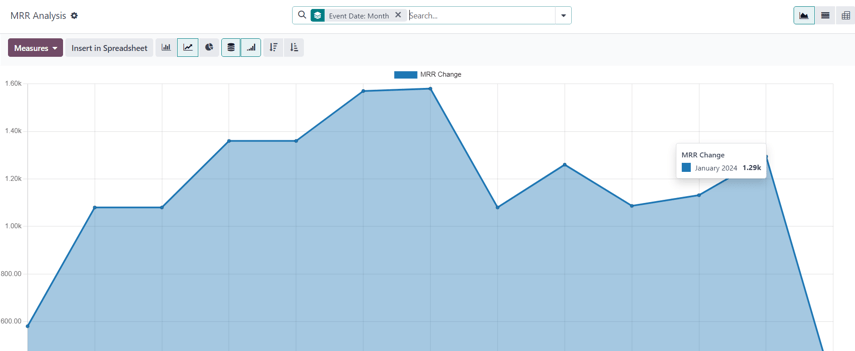
MRR 分析
要存取 MRR 分析 報告頁面,請前往 。
預設情況下,MRR 分析 報告頁面上顯示的資料,會以圖表檢視模式顯示,並選用 折線圖、堆疊 及 累積 選項。
A default filter is also found in the search bar for Event Date: Month.
按下 MRR 分析 報告頁面上的 量度 下拉式選單時,系統會顯示一系列與指標相關的選項。

MRR 分析 報告頁面的 量度 下拉式選單中,與指標相關的選項有:
生效訂購變化
ARR 變化
MRR 變化
:guilabel:`數目`(個數)
備註
預設會選用 MRR 變化 的量度選項。
其他資料