Forecast report
The Forecast report in the CRM app allows users to view upcoming opportunities and build a forecast of potential sales. Opportunities are grouped by the month of their expected closing date, and can be dragged-and-dropped to adjust the deadline.
To access the Forecast report, navigate to .
Navigate the forecast report
The default Forecast report includes opportunities assigned to the current user’s pipeline, and are expected to close within four months. It also shows opportunities without an assigned expected closing date. The opportunities are grouped by month in a (Kanban) view.

Expected closing date
Opportunities are grouped by the date assigned in the Expected Closing field on an opportunity form. To change this date directly from the Forecast page, select the Kanban card for the desired opportunity, then click and drag the card to the desired column.
Note
The default time frame for the forecast is month. This can be changed by clicking the (down) icon next to the Search… bar at the top of the report. Under the Group By heading in the resulting drop-down menu, click Expected Closing to expand the list of available options, and select a desired amount of time from the list.
After an opportunity is added to a new month, the Expected Closing field on the opportunity form is updated to the last date of the new month.
Tip
The Expected Closing field can also be manually updated on the opportunity card. To do that, click on the Kanban card for an opportunity on the Forecast page to open the opportunity’s detail form. Click in the Expected Closing field, and use the calendar popover to select a new closing date.
Prorated revenue
The prorated revenue is the Expected Revenue amount that is displayed at the top of the column for each month on the Forecast reporting page. This value is situated to the right of the progress bar. The calculation for Expected Revenue is the total of the prorated revenue specific to that particular time frame.
The prorated revenue is calculated using the formula below:
As opportunities are moved from one column to another, the column’s revenue is automatically updated to reflect the change.
Example
A forecast report for June includes two opportunities:
The first opportunity, Global Solutions, has an expected revenue of $3,800, and a probability
of 90%. This results in a prorated revenue of $3,420.
The second opportunity, Quote for 600 Chairs, has an expected revenue of $22,500, and a
probability of 20%. This results in a prorated revenue of $4,500.
The combined prorated revenue of the opportunities is $7,920, which is listed at the top of the
column for the month.

See also
For more information on how probability is assigned to opportunities, see Assign leads with predictive lead scoring
View results
Click the (area chart) icon to change to graph view. Then, click the corresponding icon at the top of the report to switch to a (bar chart), (line chart), or (pie chart).

Click the (pivot) icon to change to the pivot view, or the (list) icon to change to the list view.
Tip
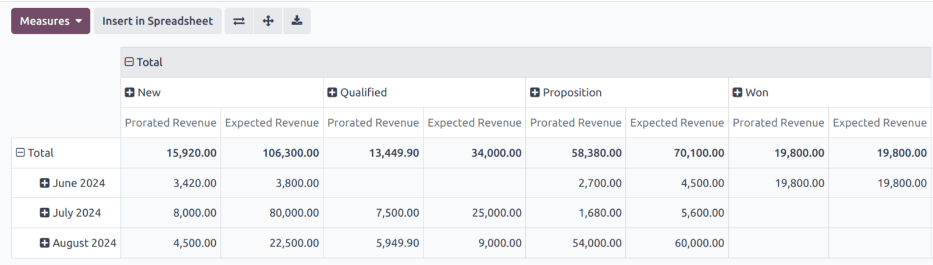
The pivot view can be used to view and analyze data in a more in-depth manner. Multiple measures can be selected, and data can be viewed by month, and by opportunity stage.
See also
To save this report as a favorite, see Favorites.