Expected revenue report
Expected revenue is the total cash value of leads that are expected to close by a certain date, usually the end of the current month.
An expected revenue report compiles all active leads in a sales pipeline that have a set expected closing date, and compares how sales teams are performing in a given time frame.

By pulling a monthly expected revenue report, sales managers can see which team members are reaching their goals, and who may need additional assistance to close valuable deals.
Create an expected revenue report
To create an expected revenue report, first navigate to . This opens the Pipeline Analysis dashboard.
Important
The Pipeline Analysis dashboard includes several filters in the search bar by default. Remove these before adding any additional custom filters.
On the top-left of the report, click Measures, then select Expected Revenue from the drop-down menu.
At the top of the page, click the 🔻(triangle pointed down) icon to the right of the Search… bar to open the drop-down menu that contains Filters, Group By, and Favorites columns. Under the Filters column, click Add Custom Filter, which opens an Add Custom Filter pop-up window.
Add custom filters
In order to generate an expected revenue report, filters need to be created for the following conditions:
Expected closing date: limits results to only include leads expected to close within a specific time frame.
Exclude unassigned leads: excludes leads without an assigned salesperson.
Specific sales teams: limits results to only include leads assigned to one or more sales teams. This filter is optional and should not be included if the report is intended for the entire company.
Add filter for expected closing date
On the Add Custom Filter pop-up window, click into the first field of the new rule.
Type Expected Closing into the Search… bar, or scroll to select it from the list.
Click in the second field and select is set. This limits the results to only include
leads where an estimated closing date is listed.
Next, click the ➕ (plus) icon to the right of the rule to duplicate it.
Tip
Using the ➕ (plus) icon makes it easy to add multiple rules based on the same filter.
In the second field of the new rule, select is between from the drop-down menu. This creates a set time frame during which the expected closing date must occur for leads to be included in the results.
Click in each date field, one at a time, and use the calendar popover window to add both a start and end date to the rule. This is usually the beginning and ending of the current month, or fiscal quarter.
Exclude unassigned leads
After filtering for the expected closing date, add a New Rule. Then, click into the new
rule’s first field, and type Salesperson in the Search… bar, or scroll through the
list to select it. Click in the rule’s second field and select is set from the drop-down
menu. This excludes any results without an assigned salesperson.
Add a filter for sales teams
Note
This filter is optional. To view results for the entire company, do not add this filter, and continue to View results.
To limit the results of the report to one or more sales teams, click New Rule. Next,
click the first field for the new rule, and type Sales Team in the Search… bar, or
scroll to search through the list to locate it.
In the rule’s second field, select is in from the drop-down menu. Selecting this operator limits results to the sales teams indicated in the next field.
Lastly, click into the third field, and either: make a selection from the complete list revealed in the popover menu, or type the first few characters of the specific sales team’s title to quickly find and select it as a parameter.
Tip
Multiple teams can be added to the Sales Team rule, where each parameter is treated with an
“or” (e.g. “any”) operator in the search logic.

View results
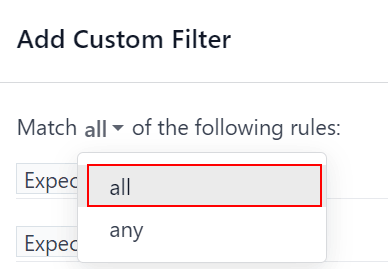
At the top of the Add Custom Filter form, there is an option to match any or all of the rules. In order to properly run the report, only records that match all of the following filters should be included. Before adding the filters, make sure all is selected in this field.
At the bottom of the Add Custom Filter form, click Add.
View options
The expected revenue report benefits from utilizing multiple views. The default graph view can be used to identify which salespeople are expected to bring in the most revenue, while the list view and pivot view provide more detail on specific deals.
The graph view is used to visualize data, and is beneficial in identifying patterns and trends.
Bar charts are used to show the distribution of data across several categories or among several salespeople.
Line charts are useful to show changing trends over a period of time.
Pie charts are useful to show the distribution, or comparison, of data among a small number of categories or salespeople, specifically how they form the meaningful part of a whole picture.
The default view for the expected revenue report is the bar chart, stacked. To change to a different graph view, click one of the icons at the top-left of the report. While both the line chart and bar chart are available in stacked view, the pie chart is not.
Graph view icons in order: bar chart, line chart, pie chart, stacked.
The list view provides a list of all leads that are expected to close by the designated date. Clicking on a lead in list view opens the record for detailed analysis, but many insights can be gleaned from the basic view.
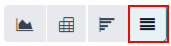
To switch to the list view, click the ≣ (list) icon at the top-right of the report.
To add additional metrics to the report, click the additional options menu indicated by the toggle icon at the top-right of the list.
Clicking the toggle icon in list view opens the additional options menu.
Select any additional metrics from the drop-down menu to add them to the list view. Some options that may be useful are Expected Closing and Probability.
The pivot view arranges all leads that are expected to close by the designated date into a dynamic table.
To switch to the pivot view, click the Pivot icon at the top-right of the report.
When the pivot view is selected for this report, the X-axis lists the stages in the pipeline, while the Y-axis defaults to group the results by their creation date. To switch these groupings, click the flip access icon (⇄) at the top of the report.
To add additional measures to the report, click the Measures button at the top-left of the report. Select any additional metrics from the drop-down menu.
To add a group to a row or column to the pivot view, click the ➕ (plus sign) next to Total, and then select one of the groups. To remove one, click the ➖ (minus sign) and de-select the appropriate option.
Click Insert in Spreadsheet to add the pivot view into an editable spreadsheet format within the Dashboards app. If the Odoo Documents app is installed, the report can be inserted into a blank or existing spreadsheet, and exported.